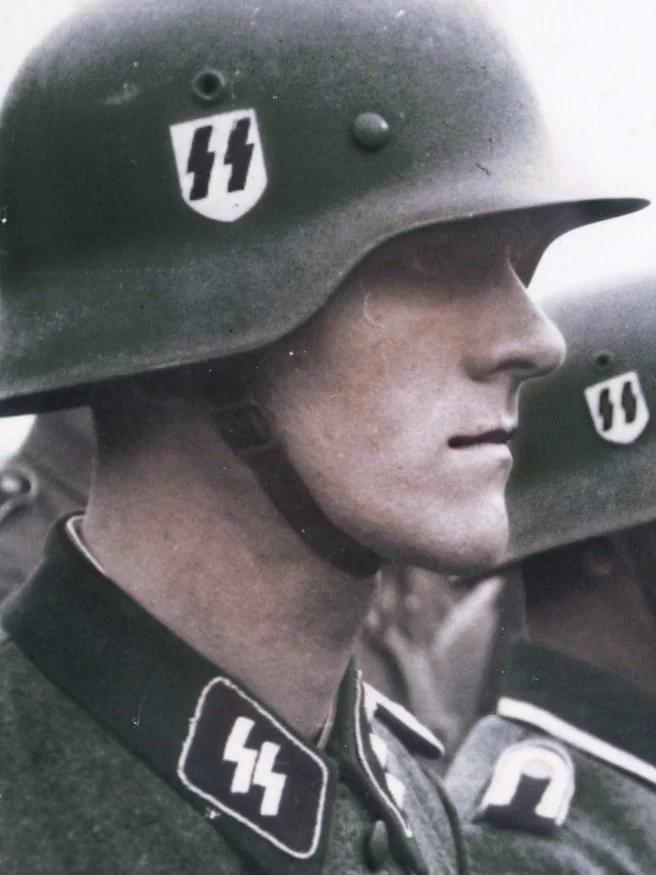
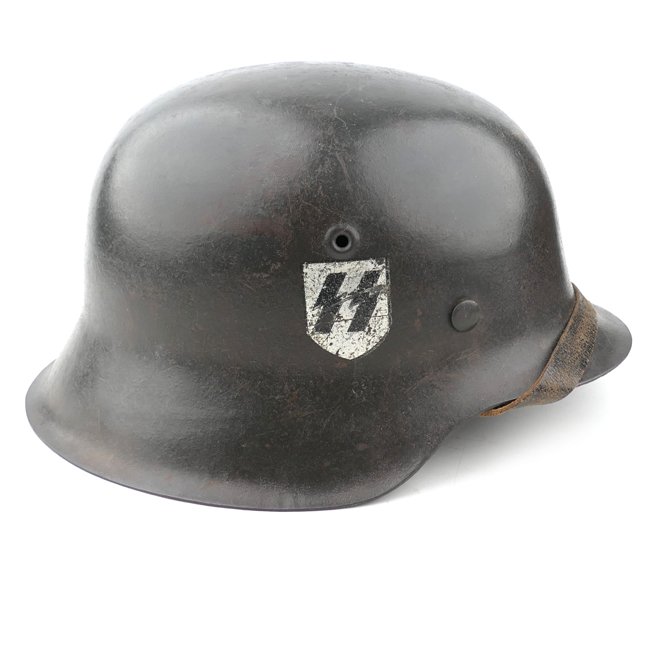
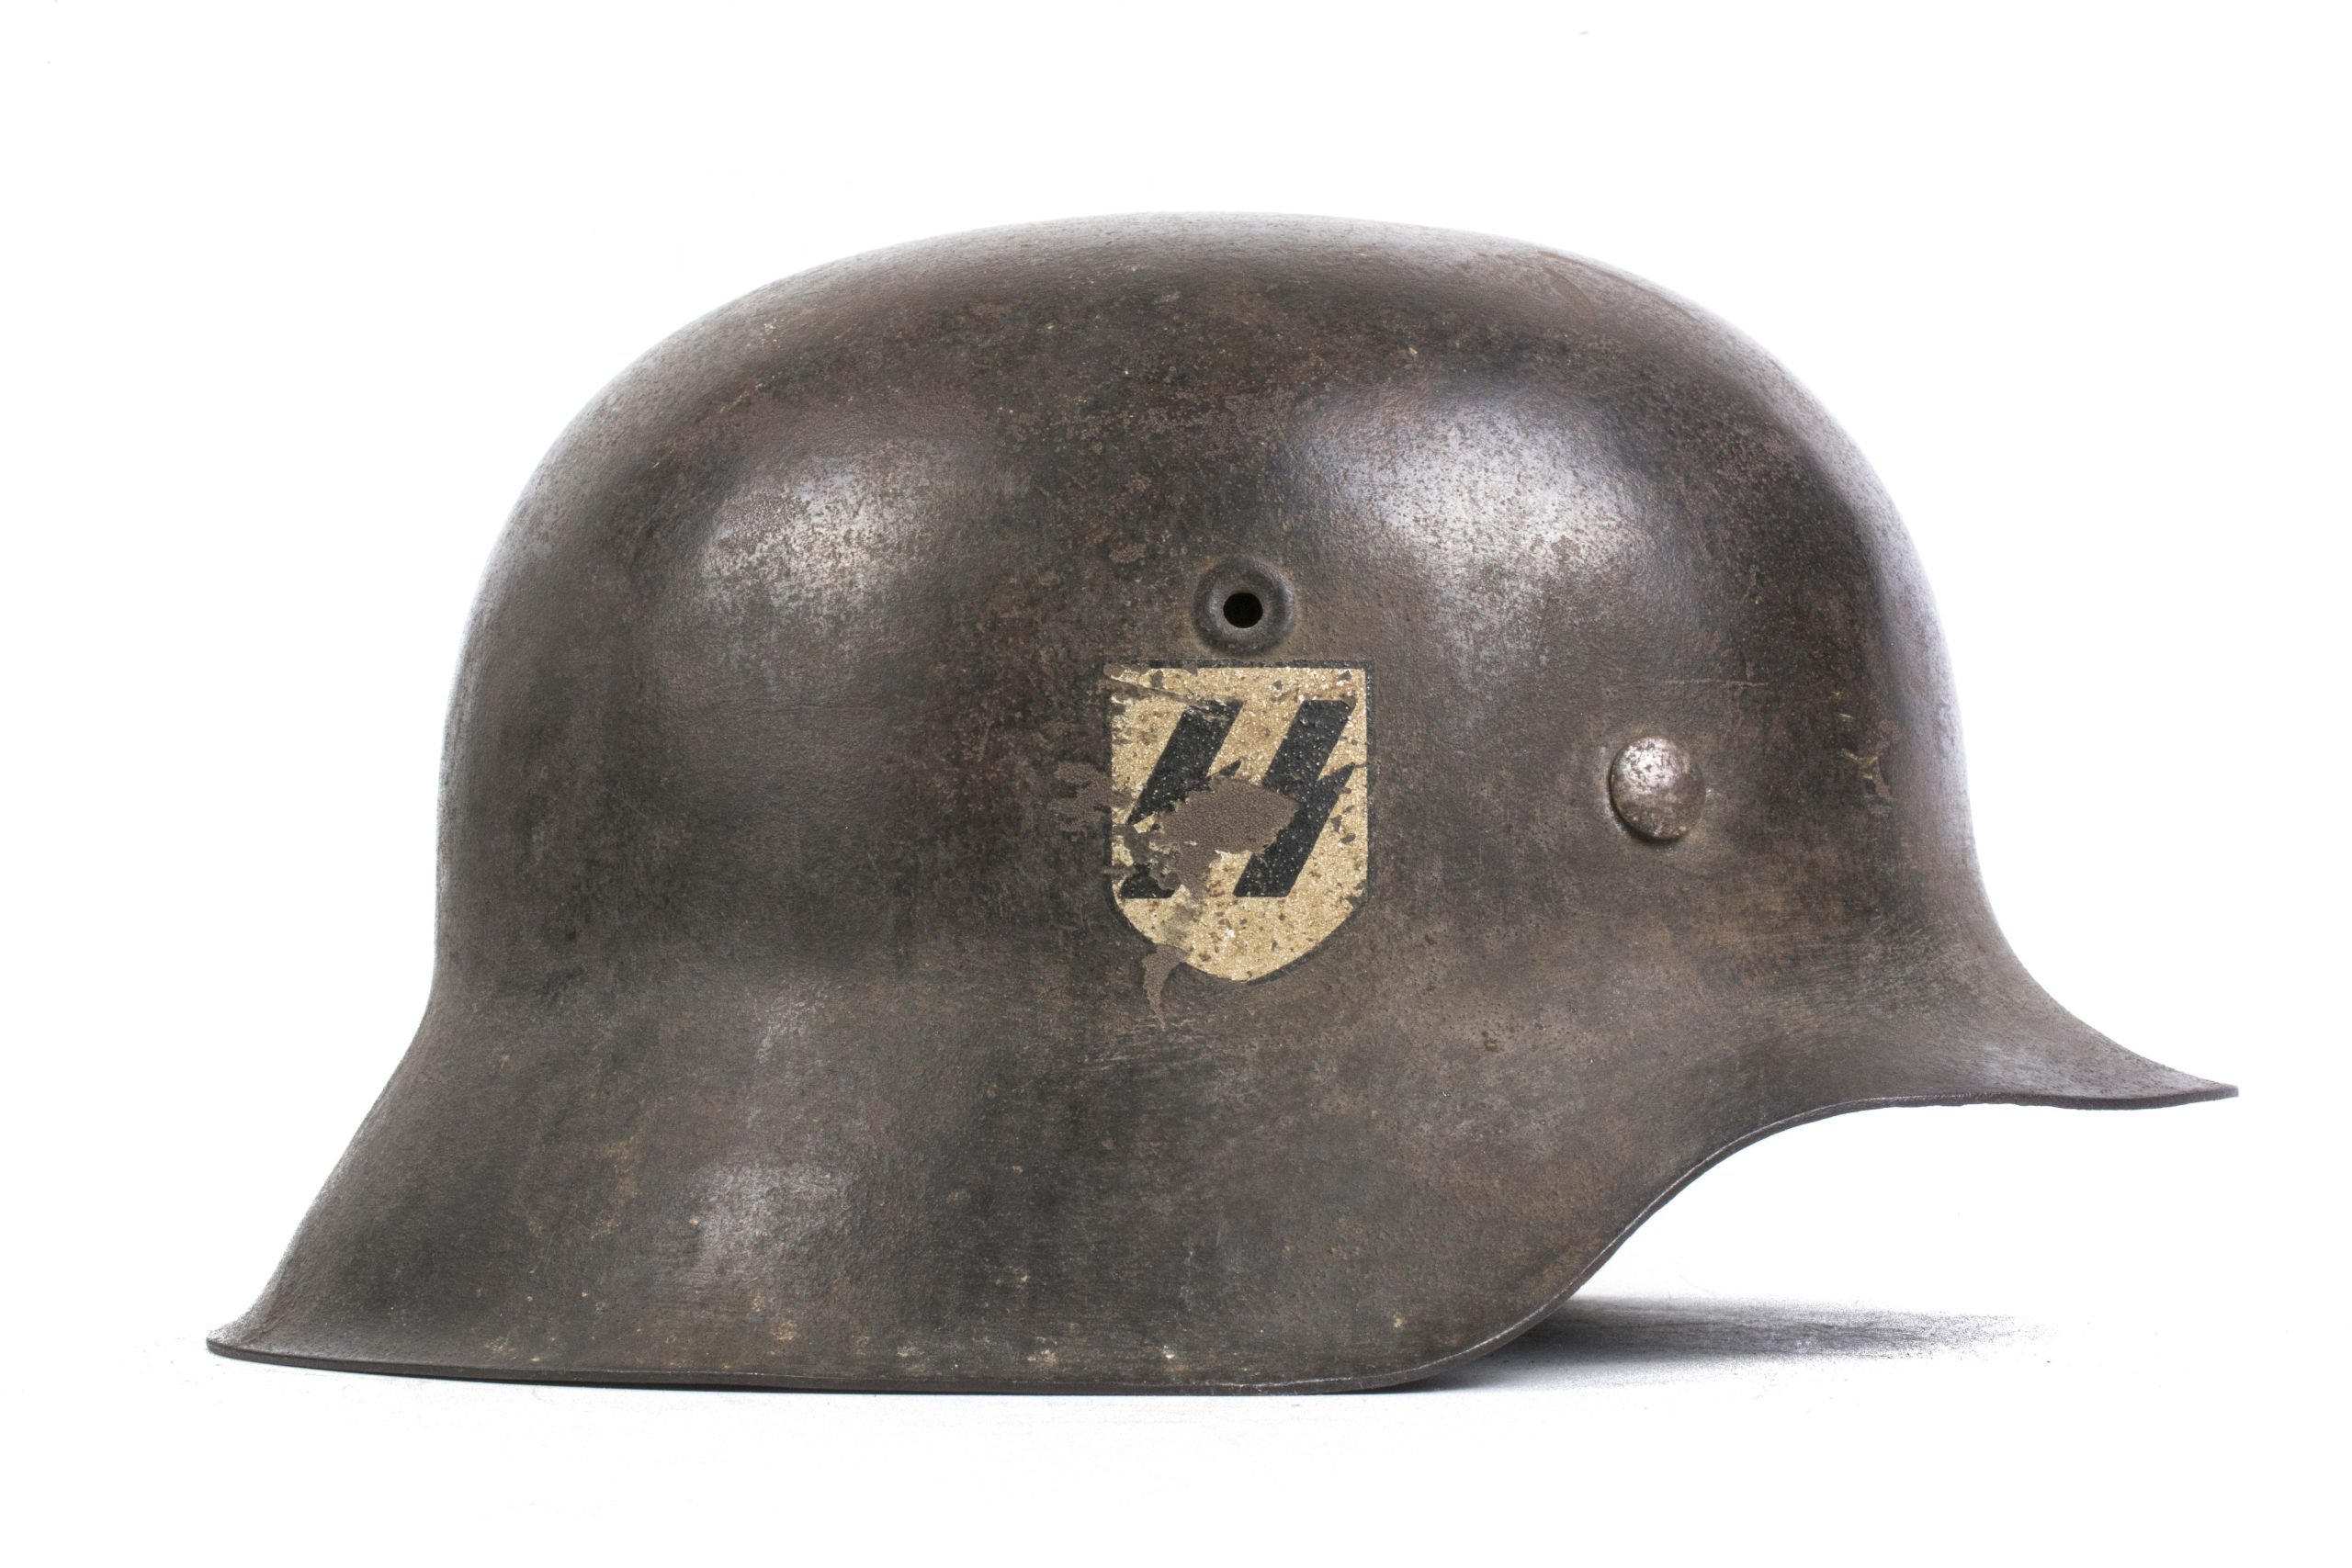
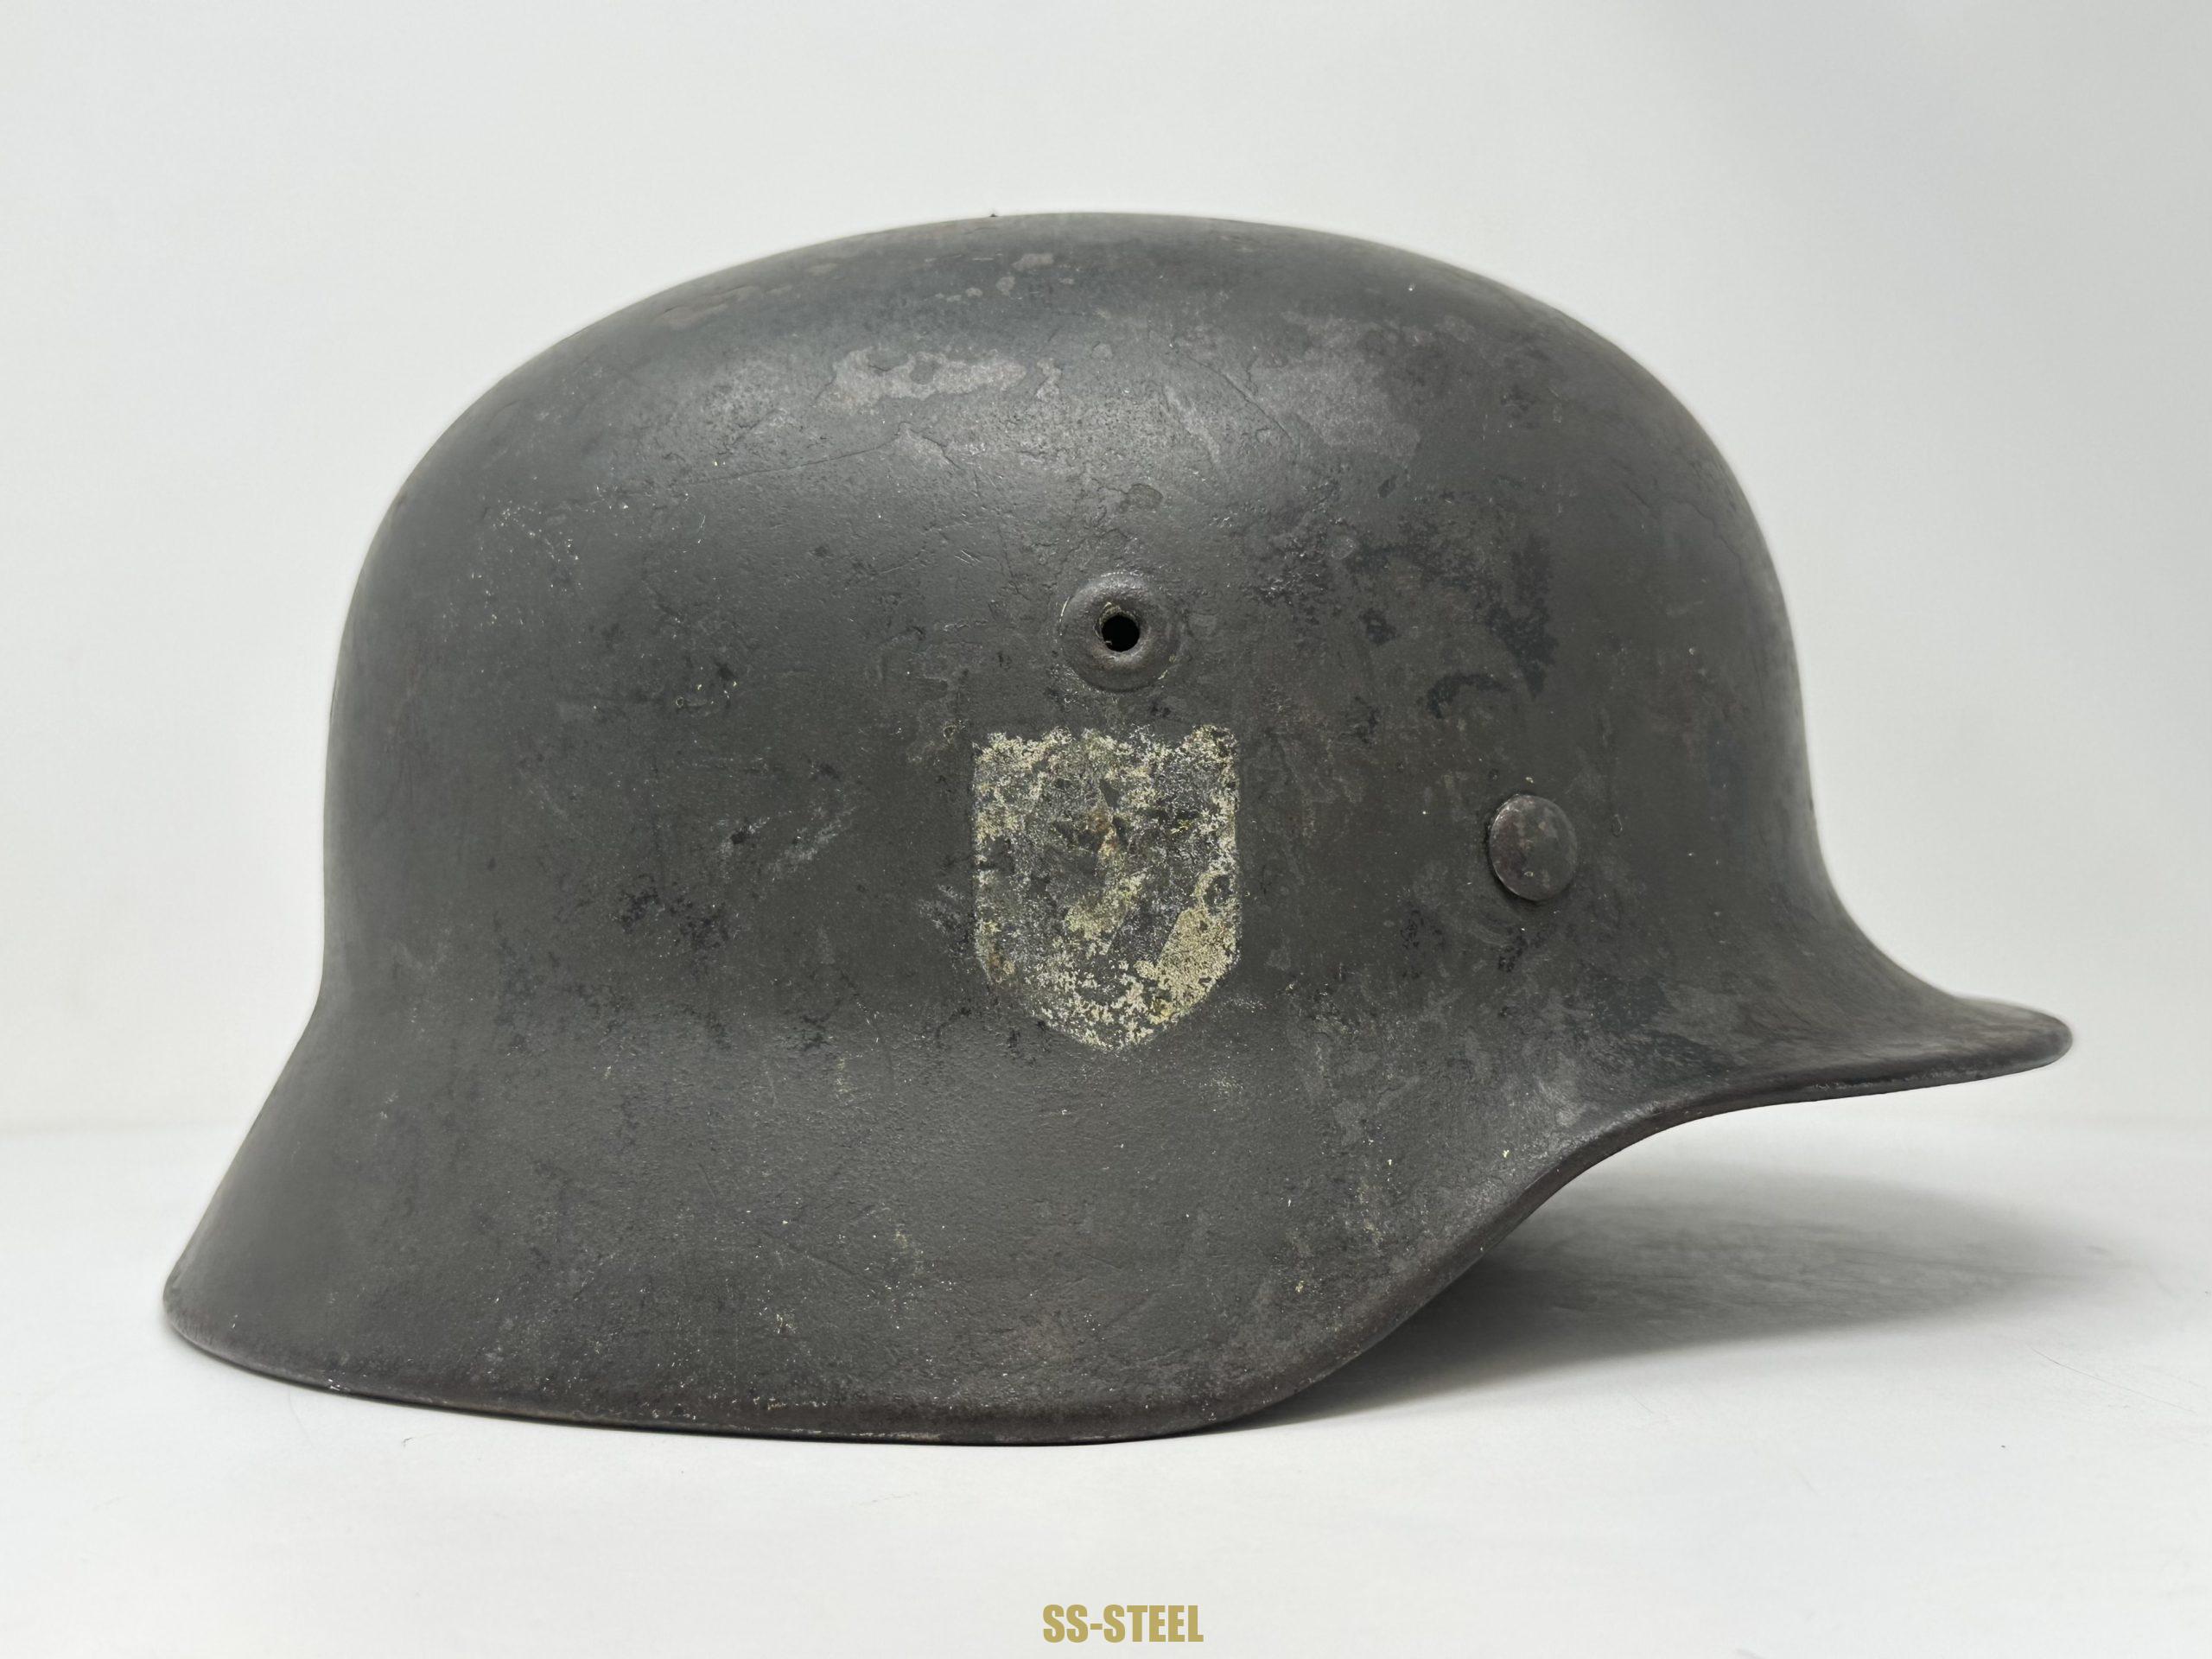
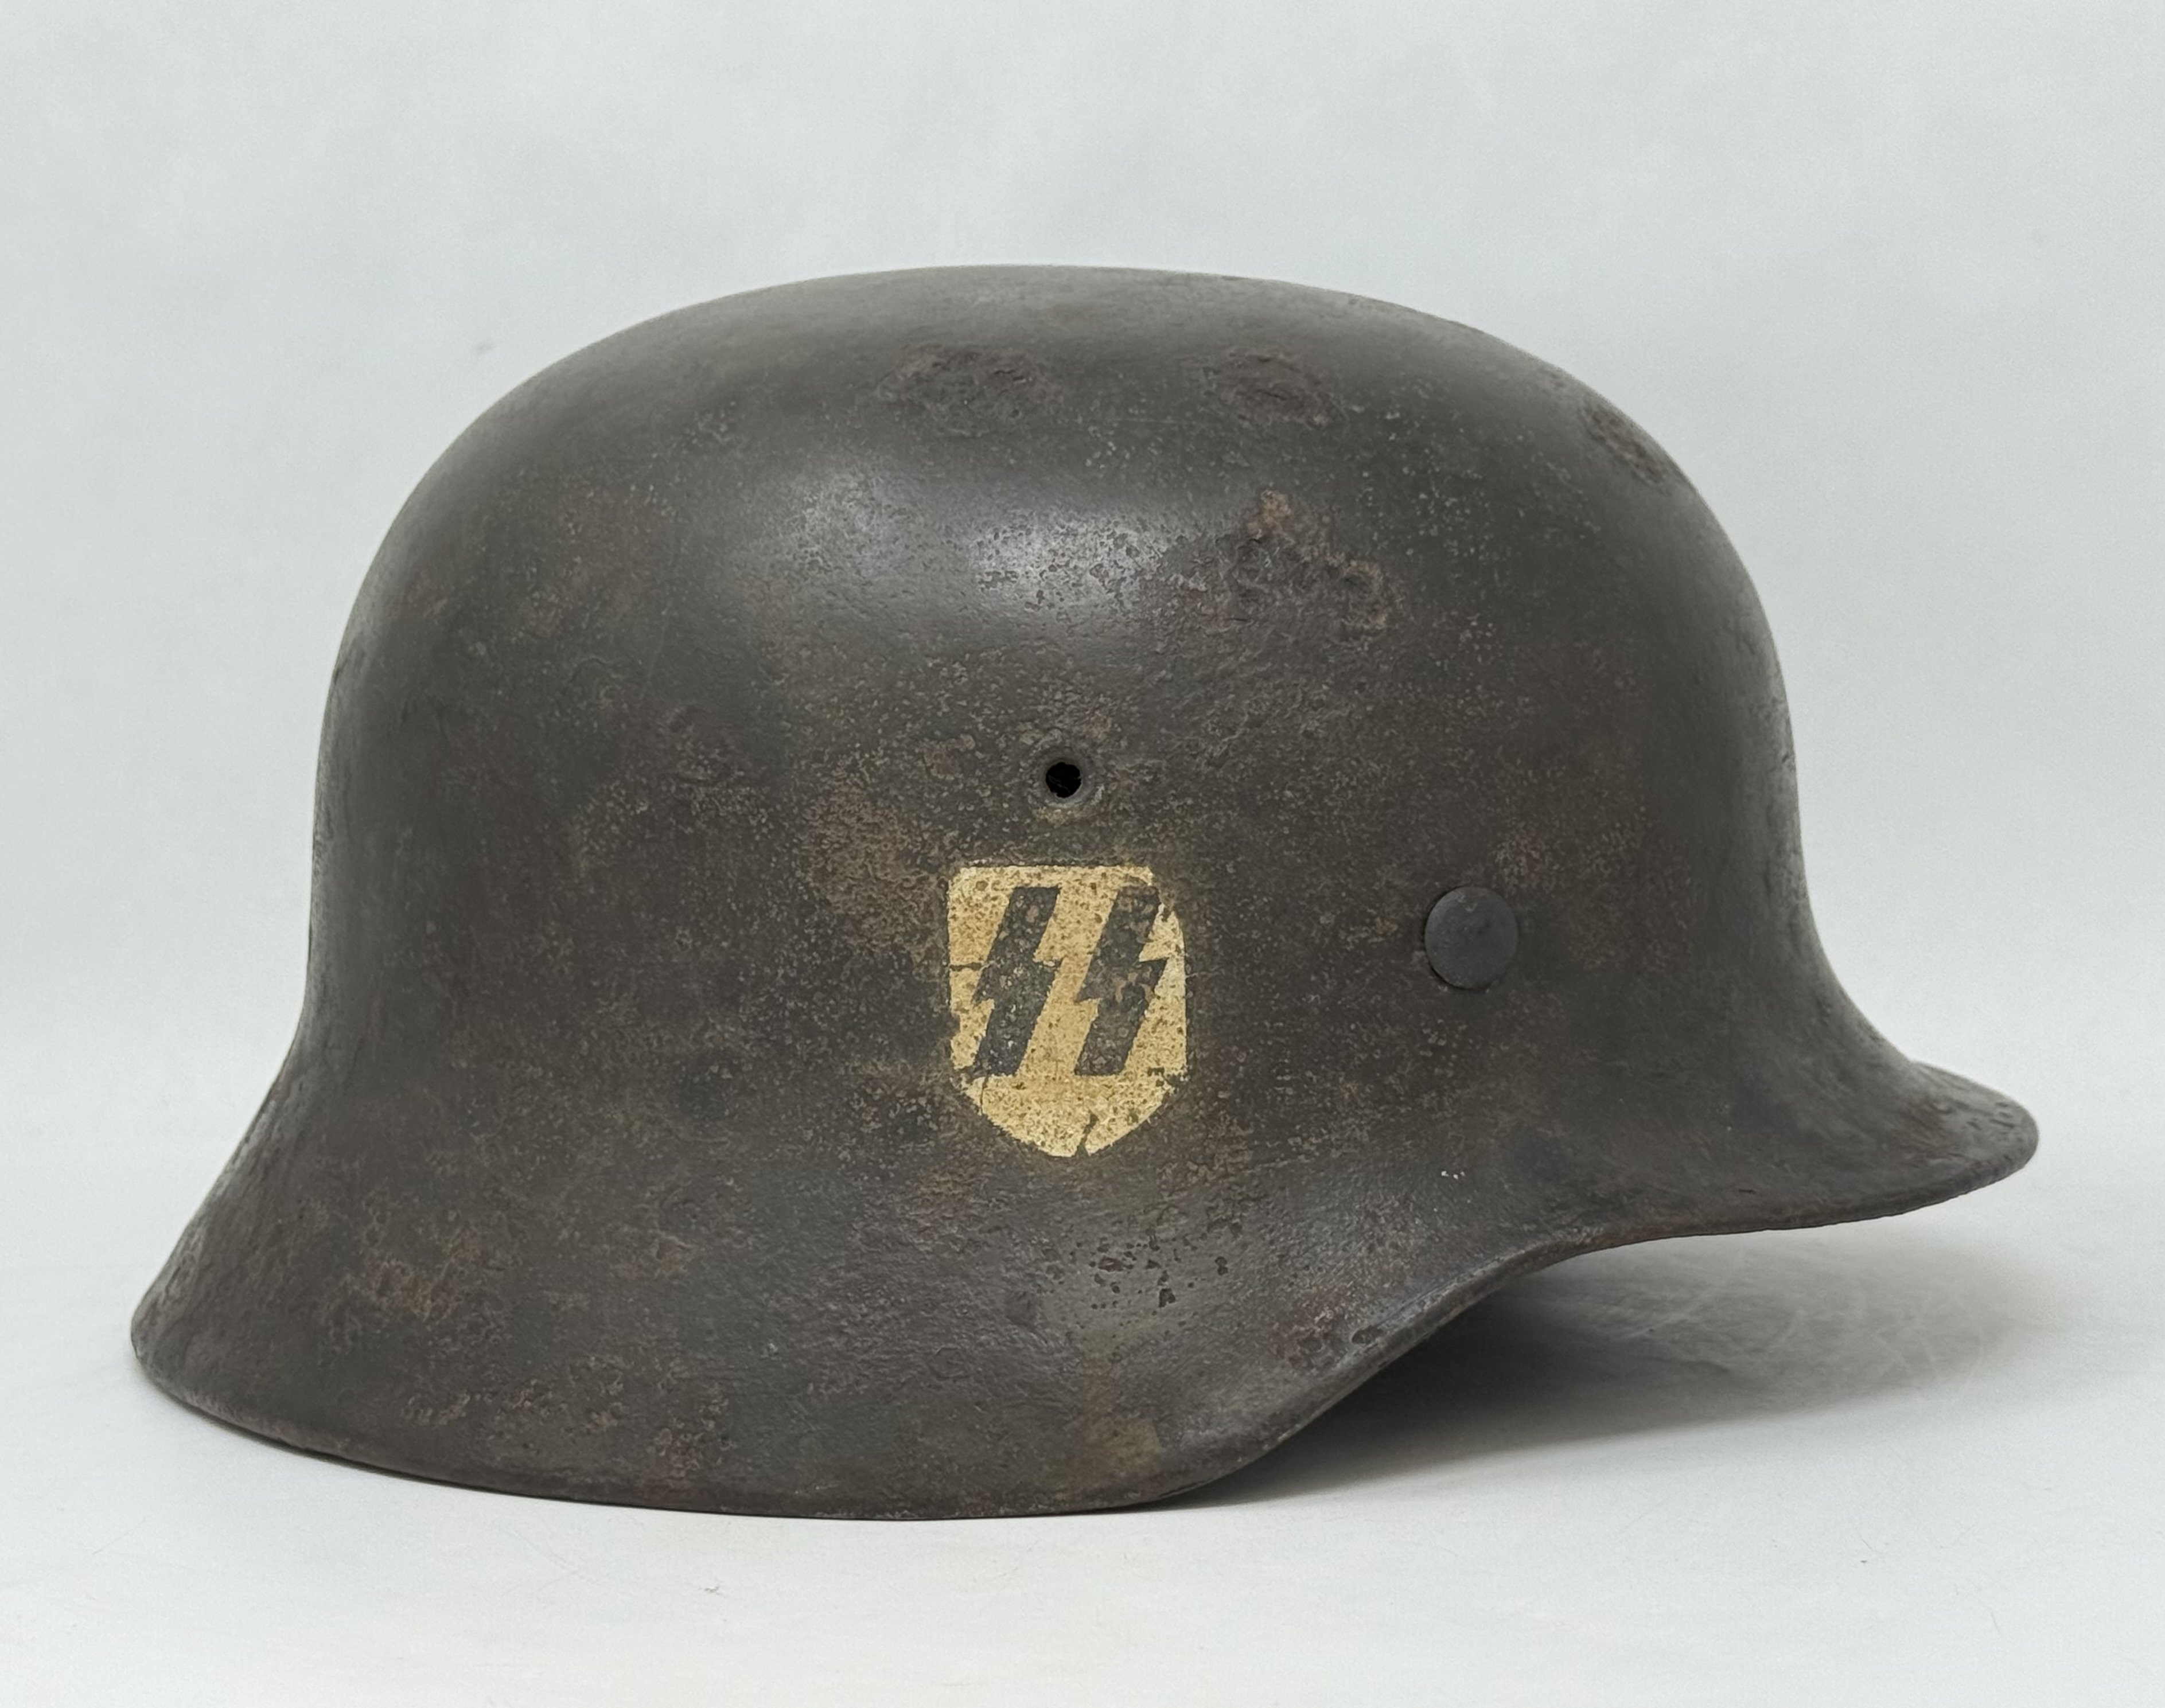
Background: Single-Decal SS Combat Helmets (No Camo, No Extras)
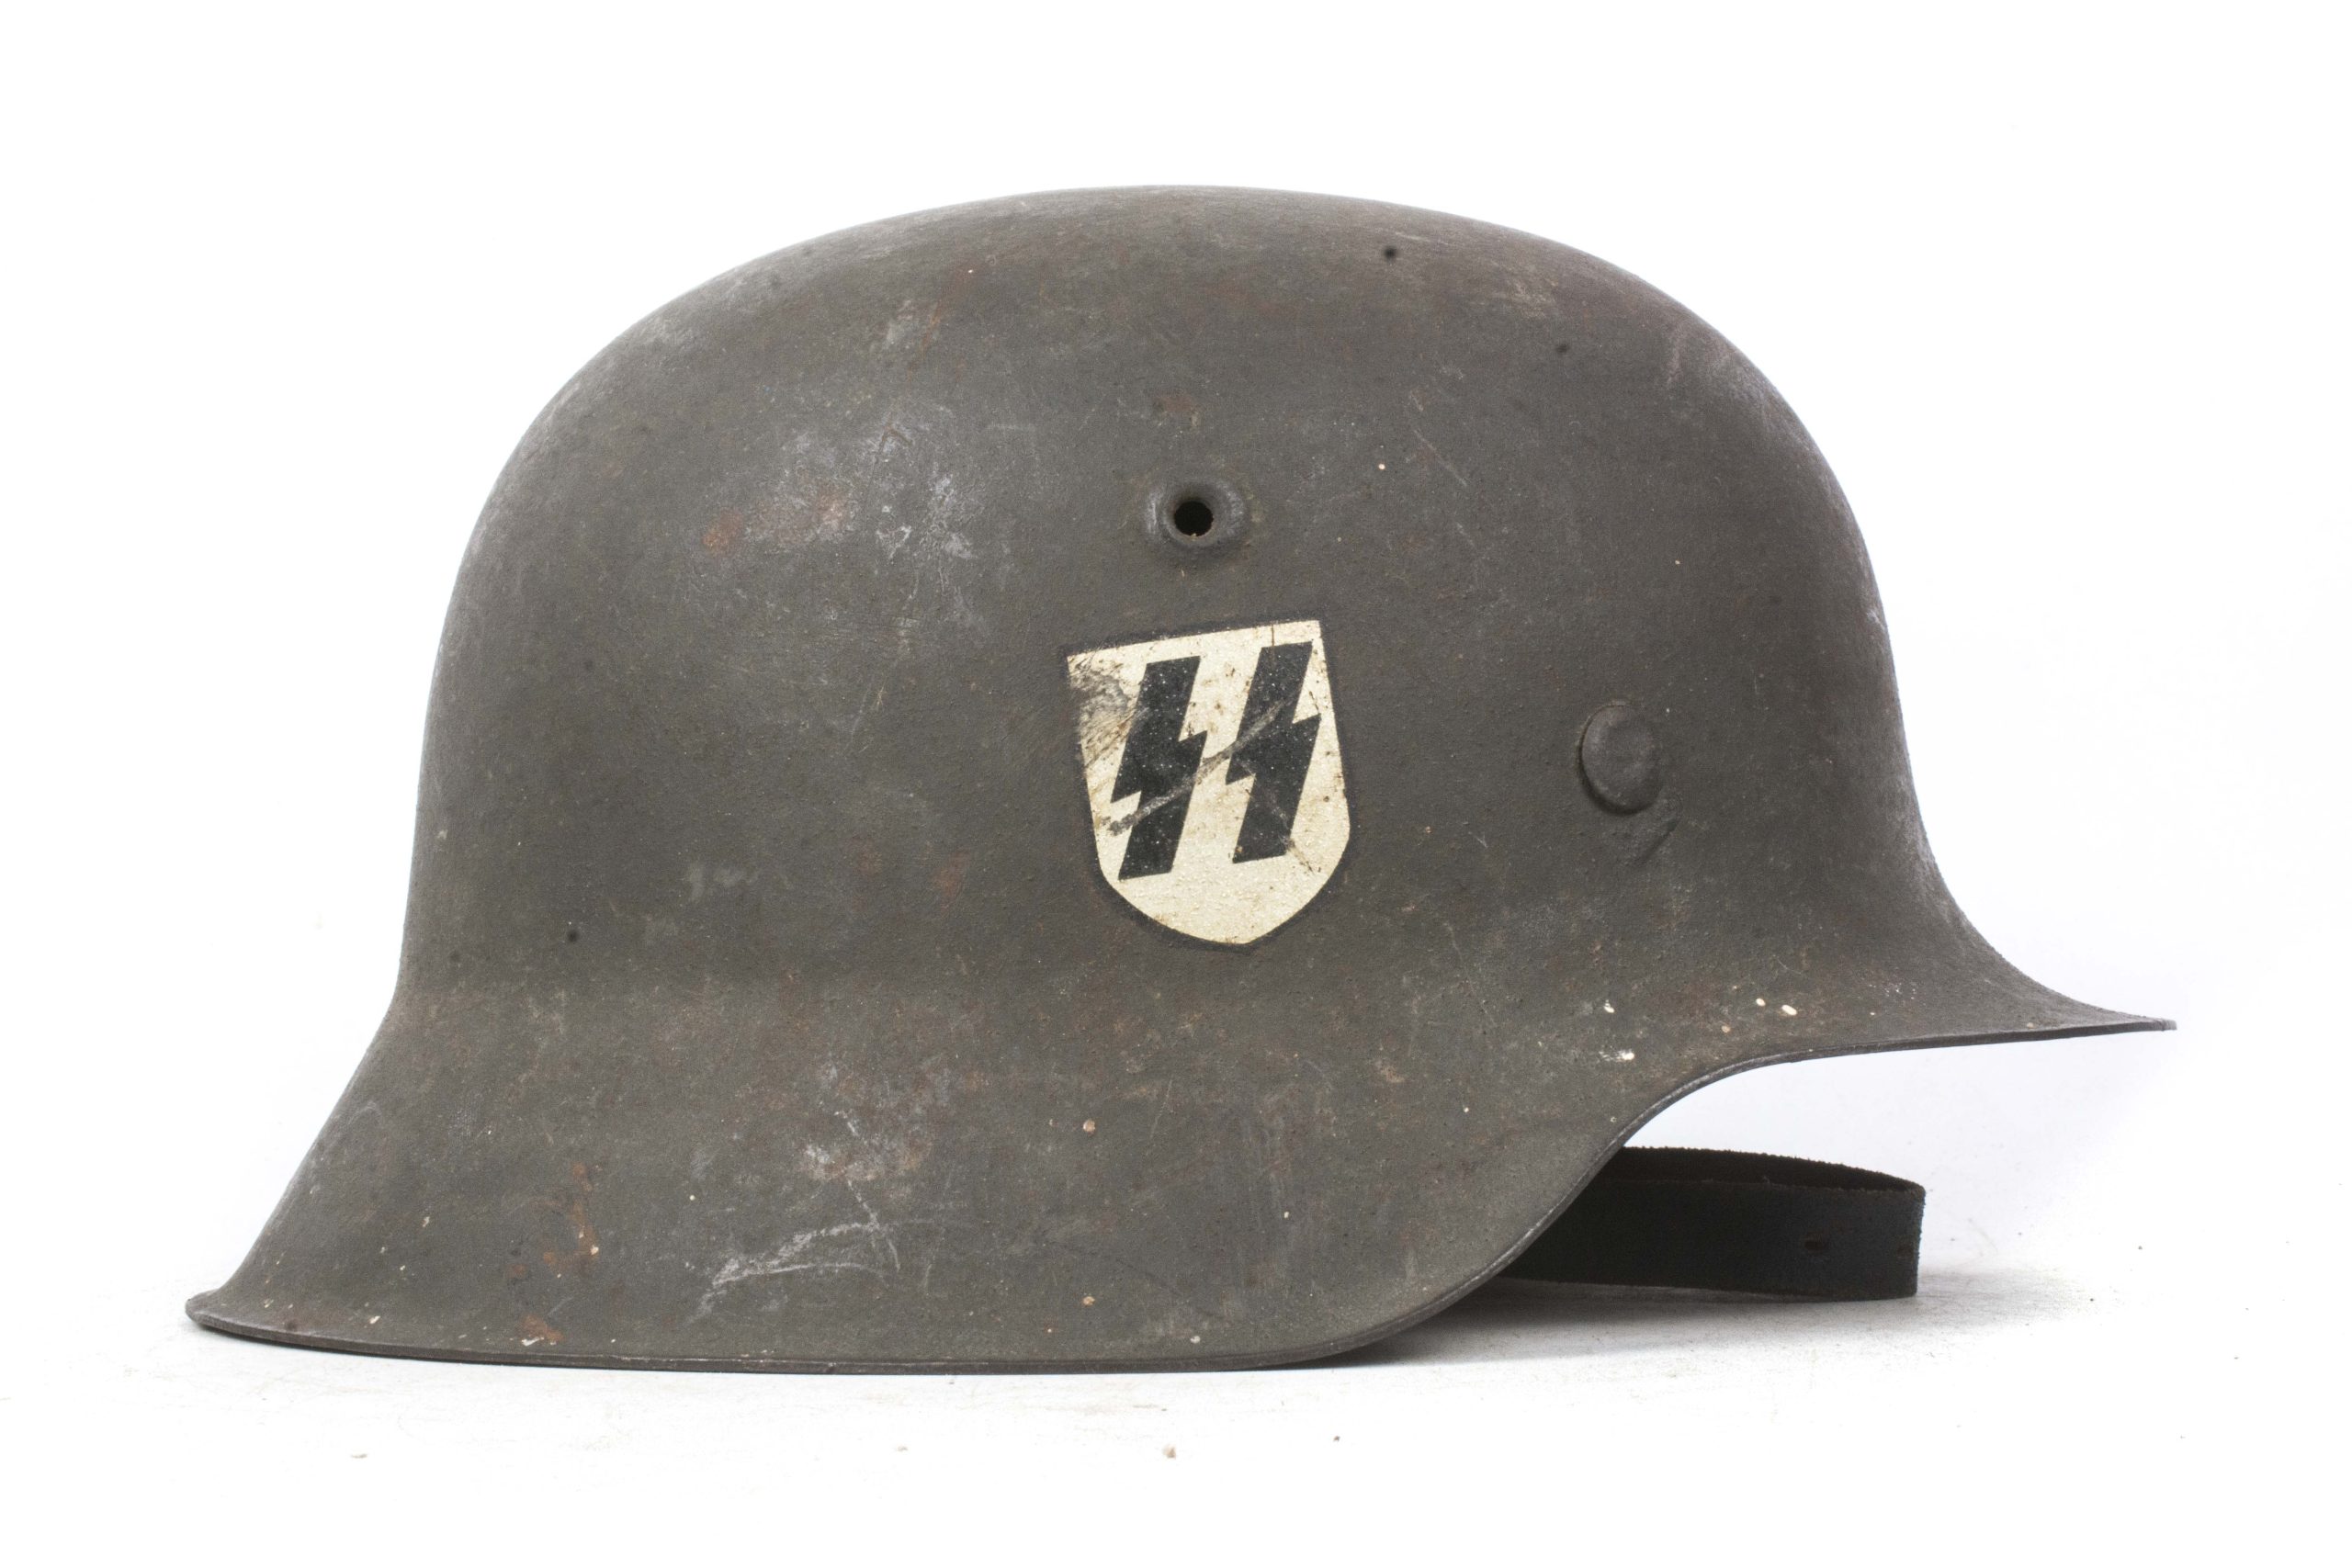
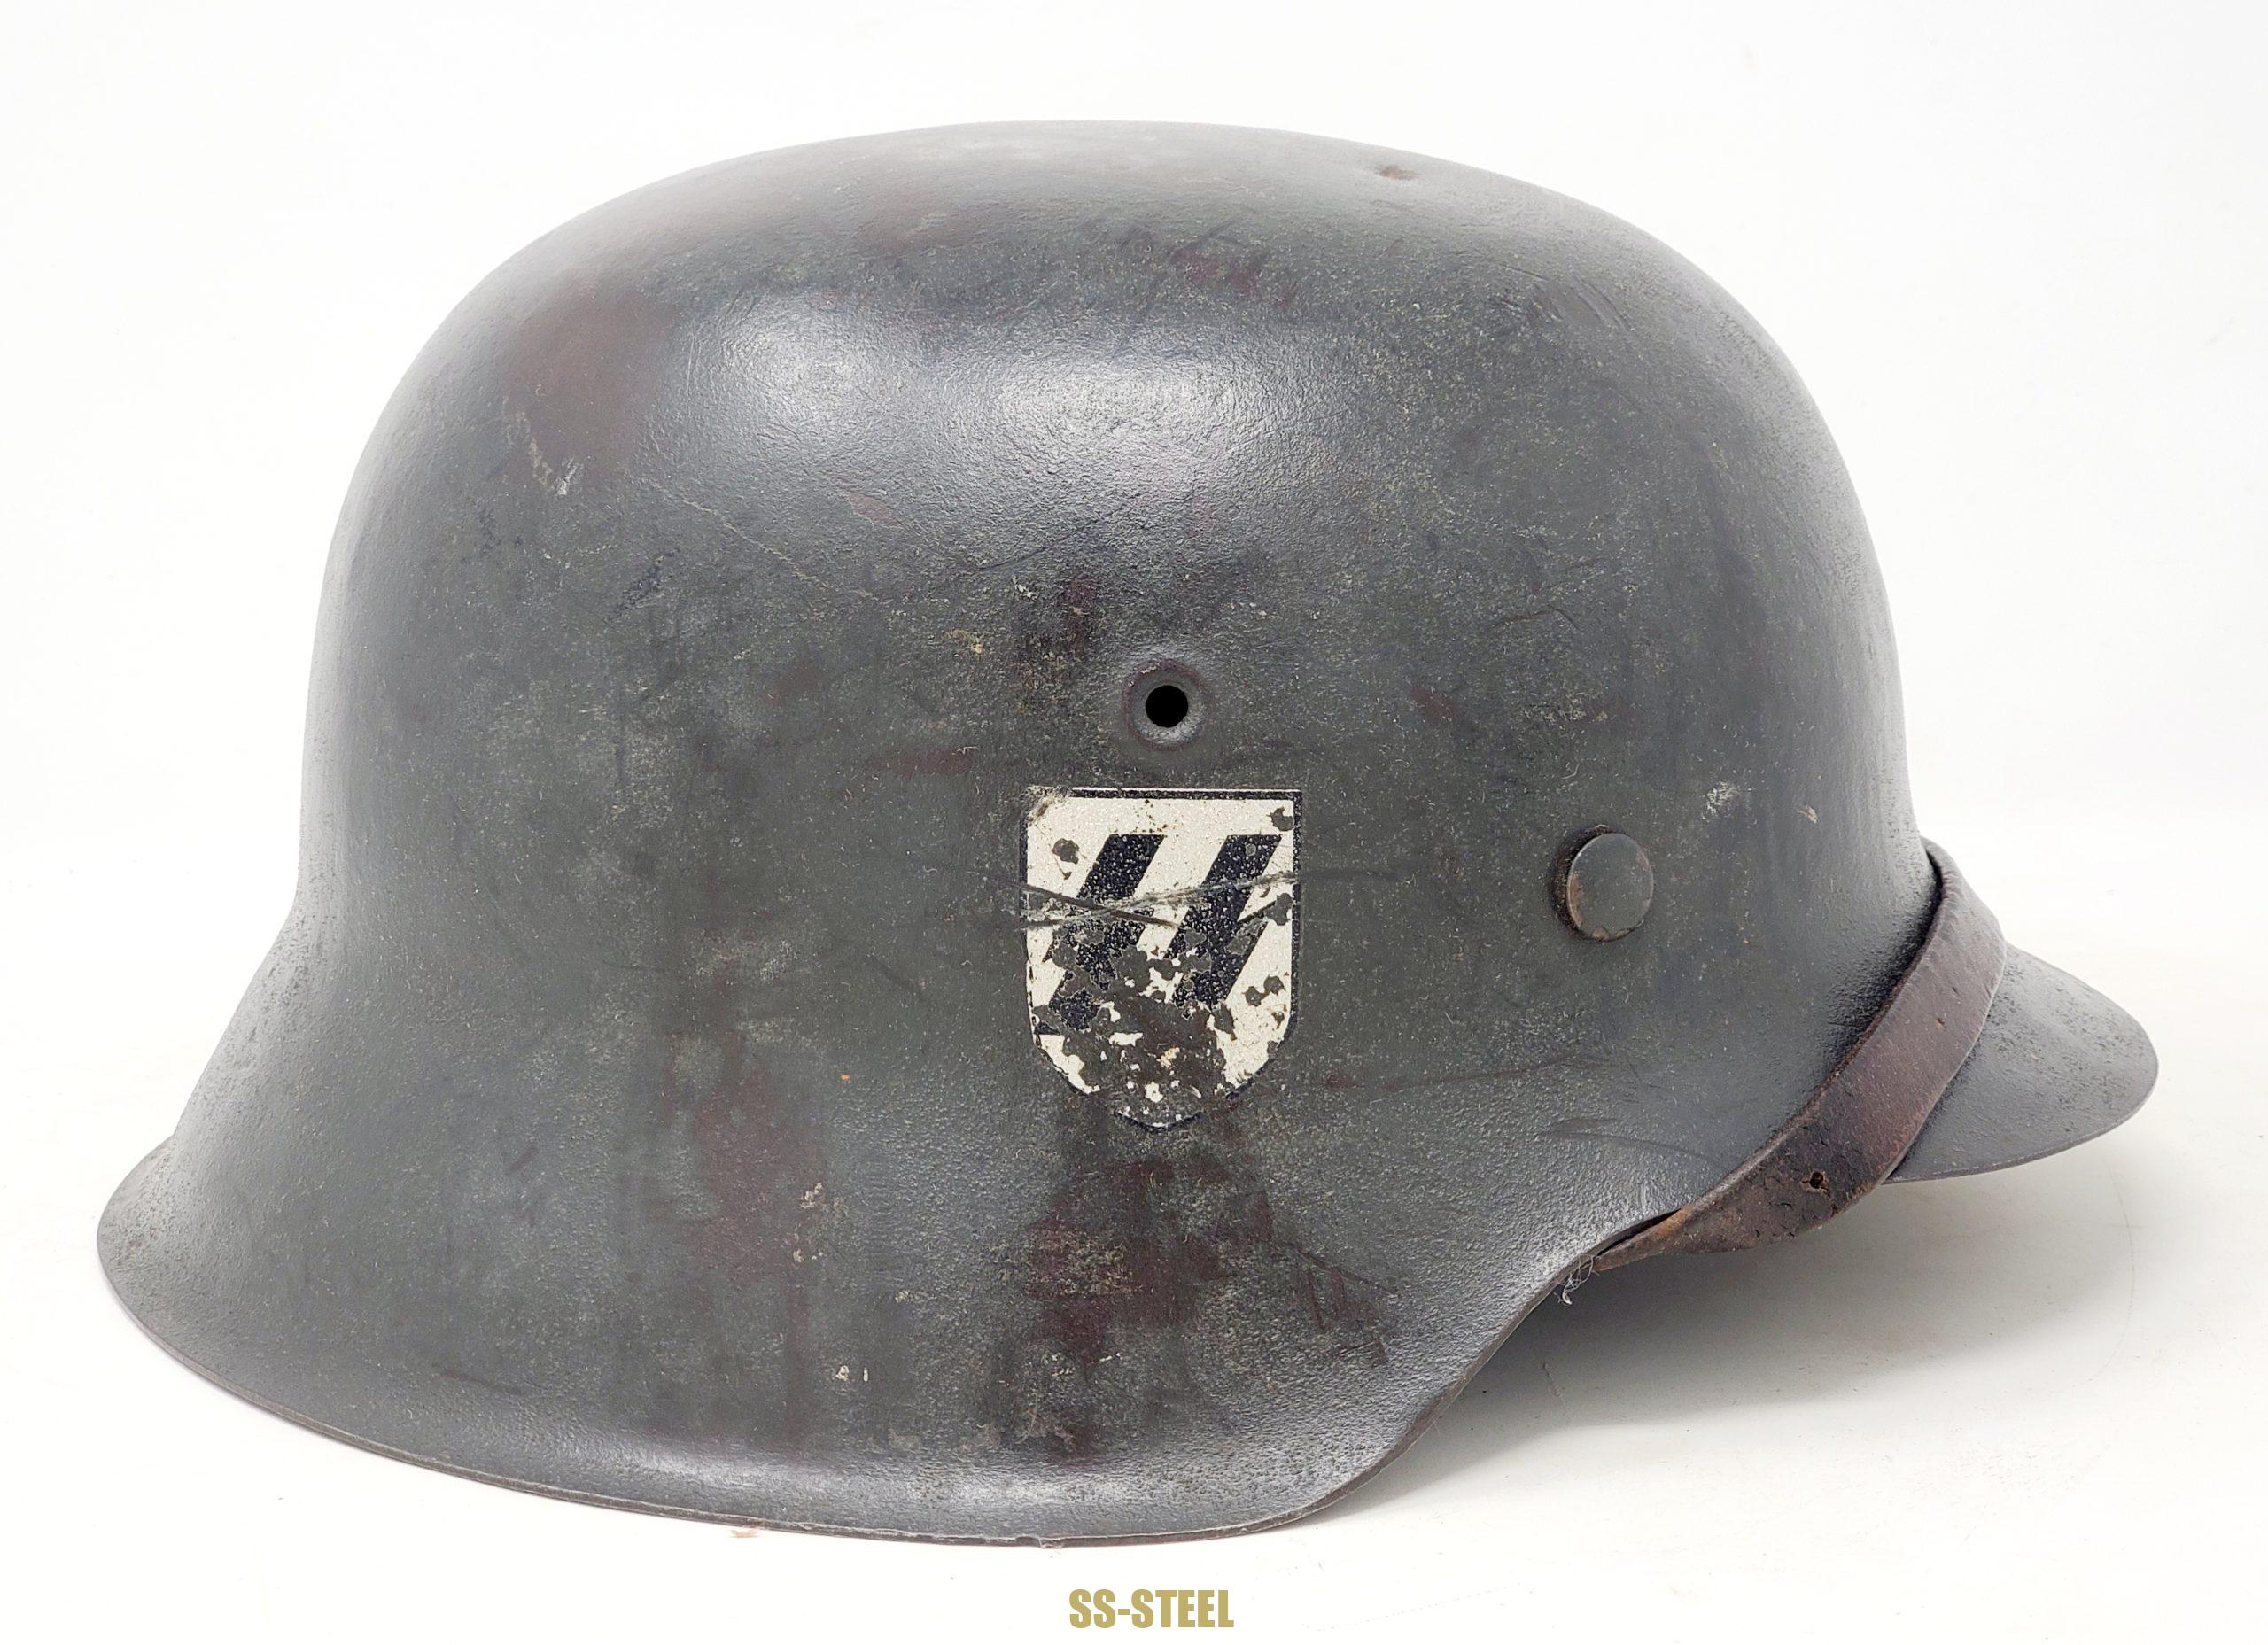
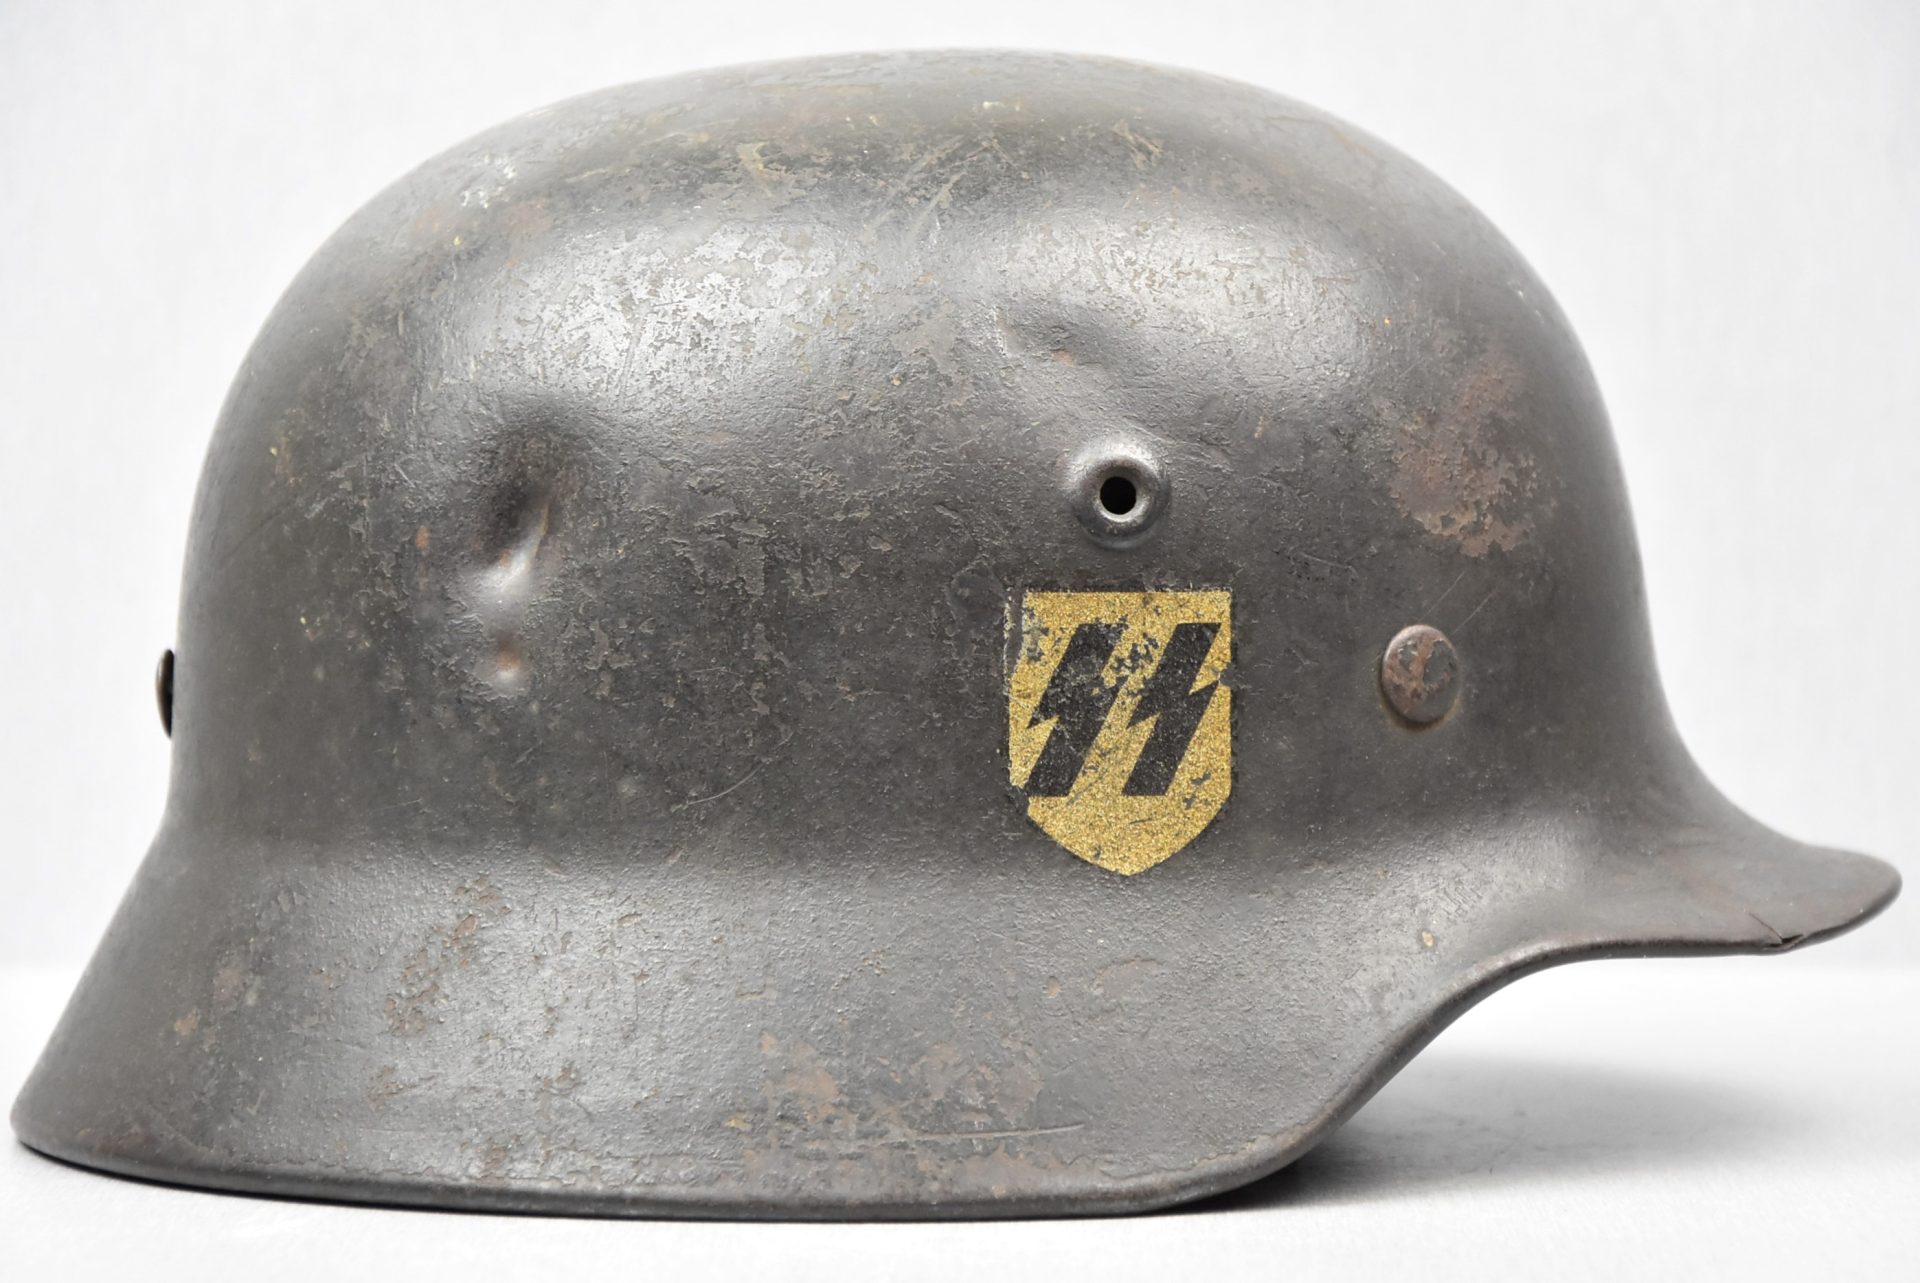
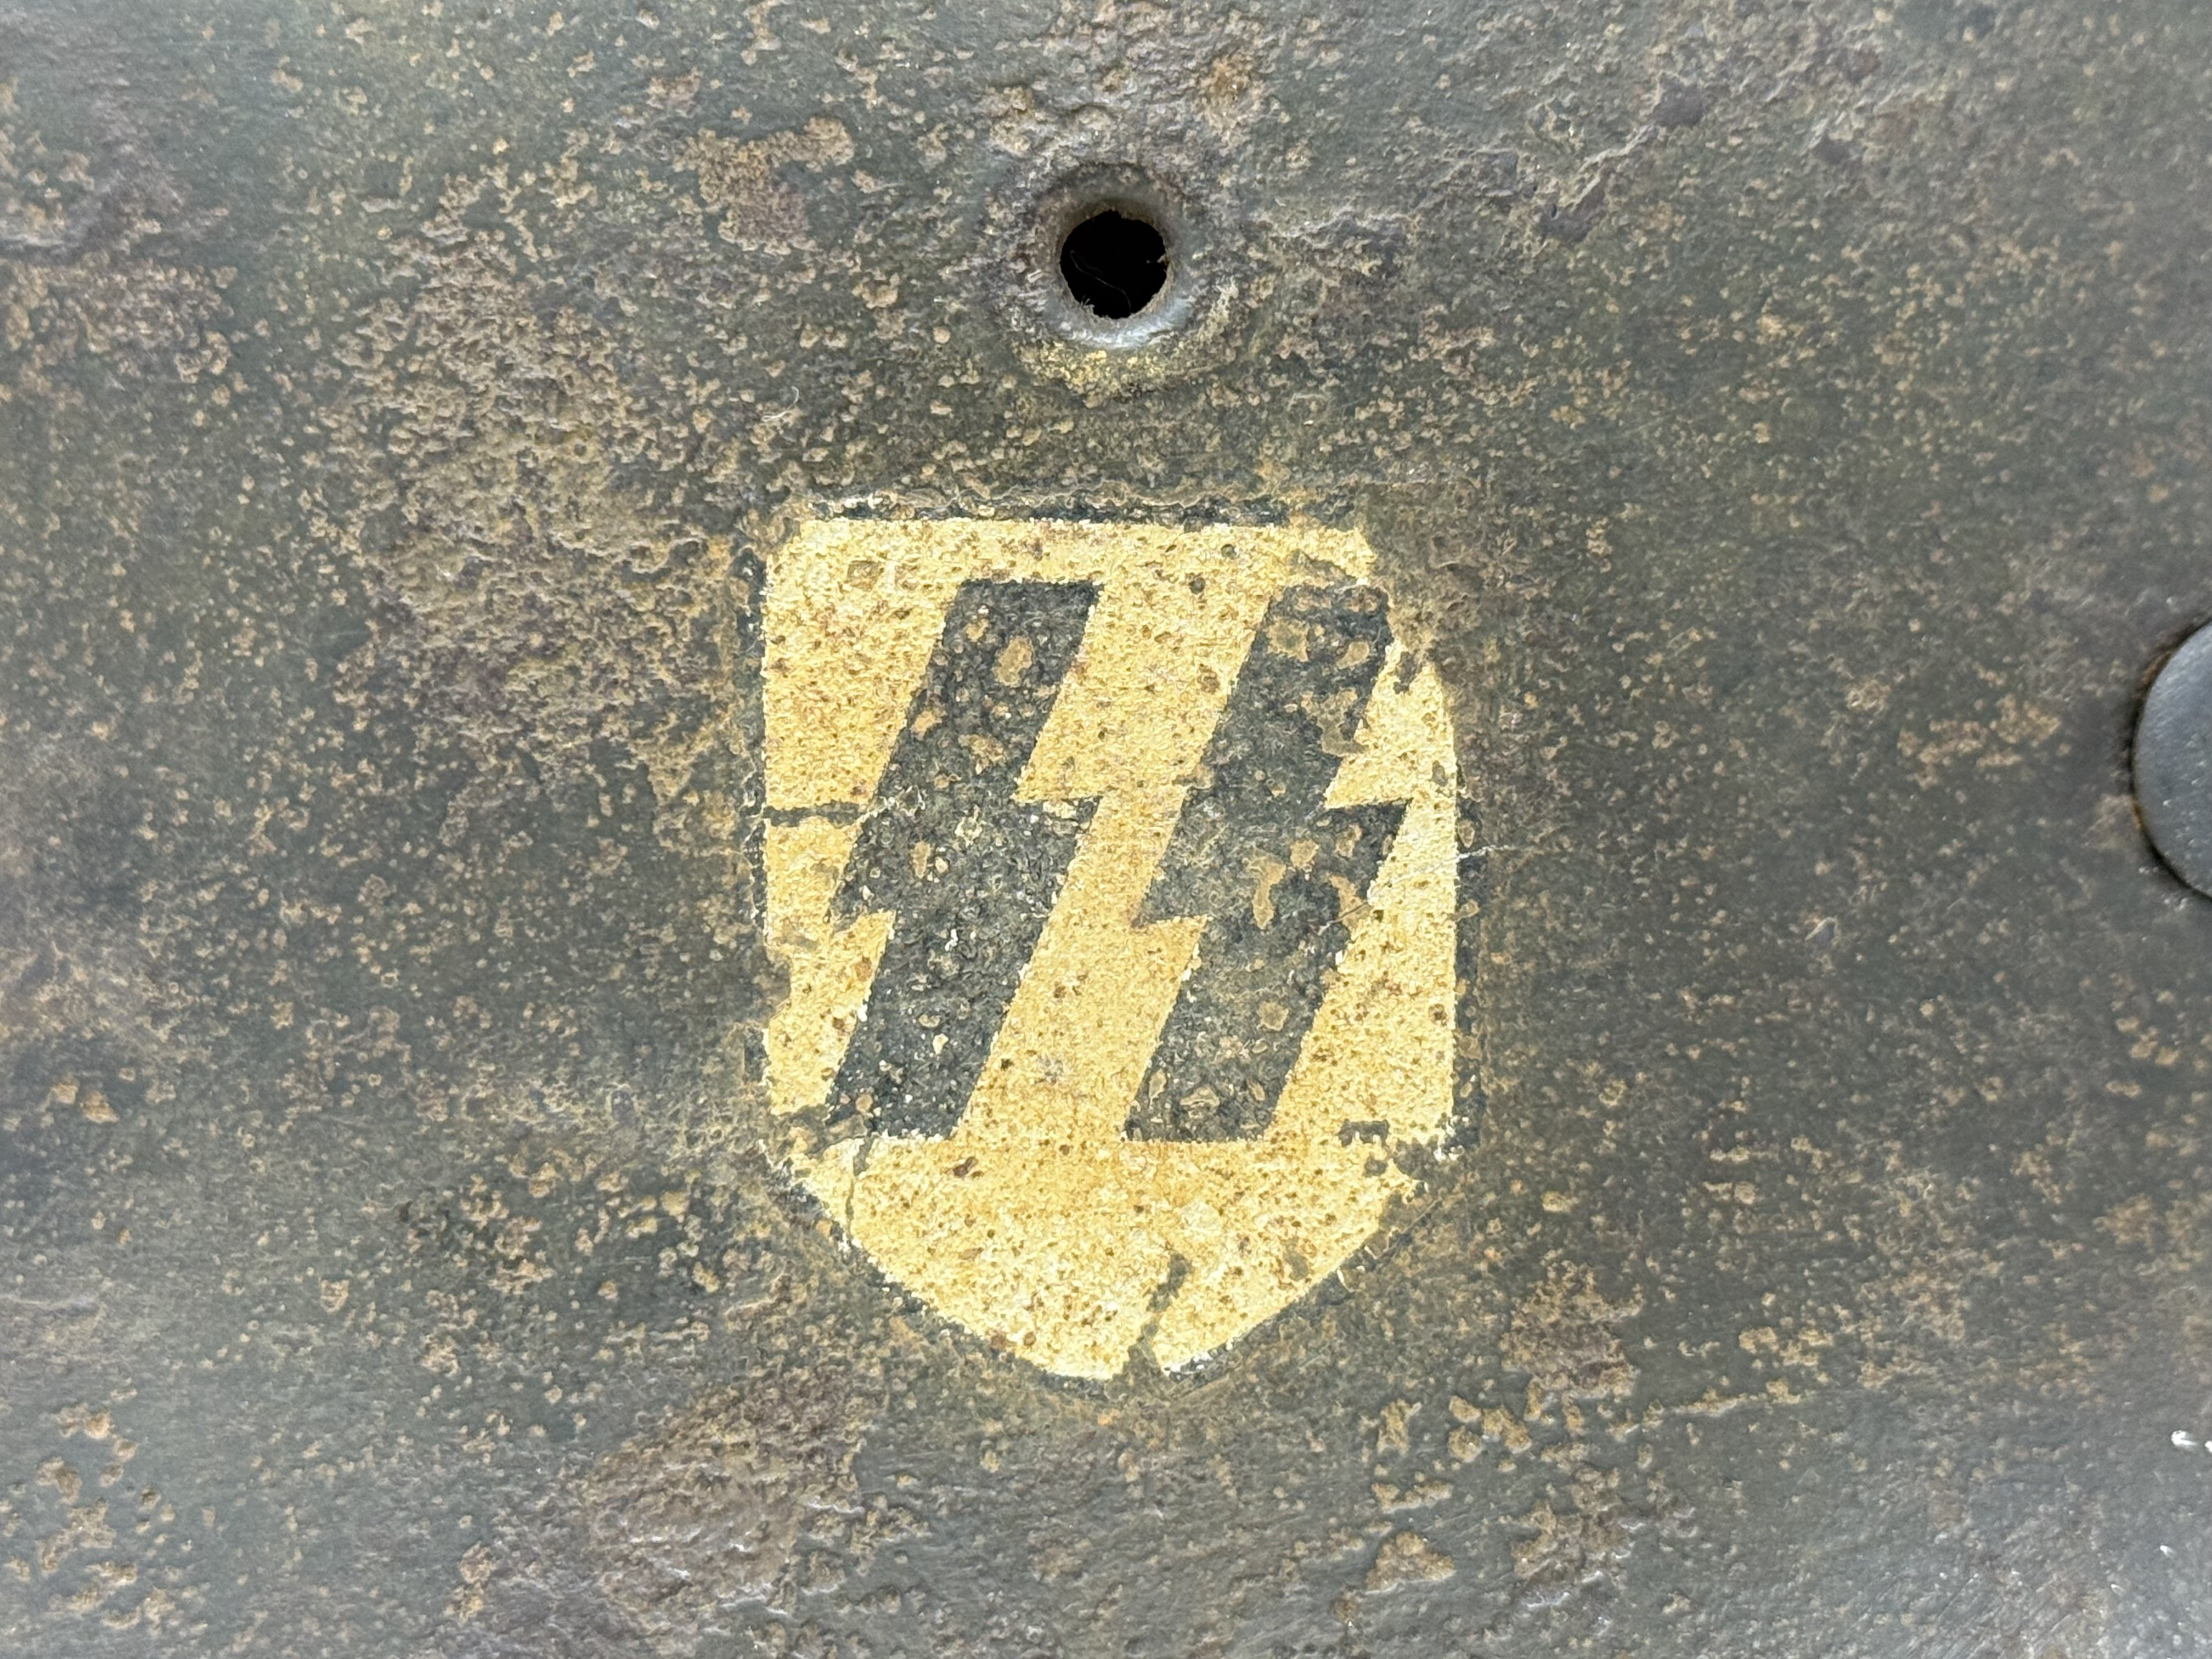
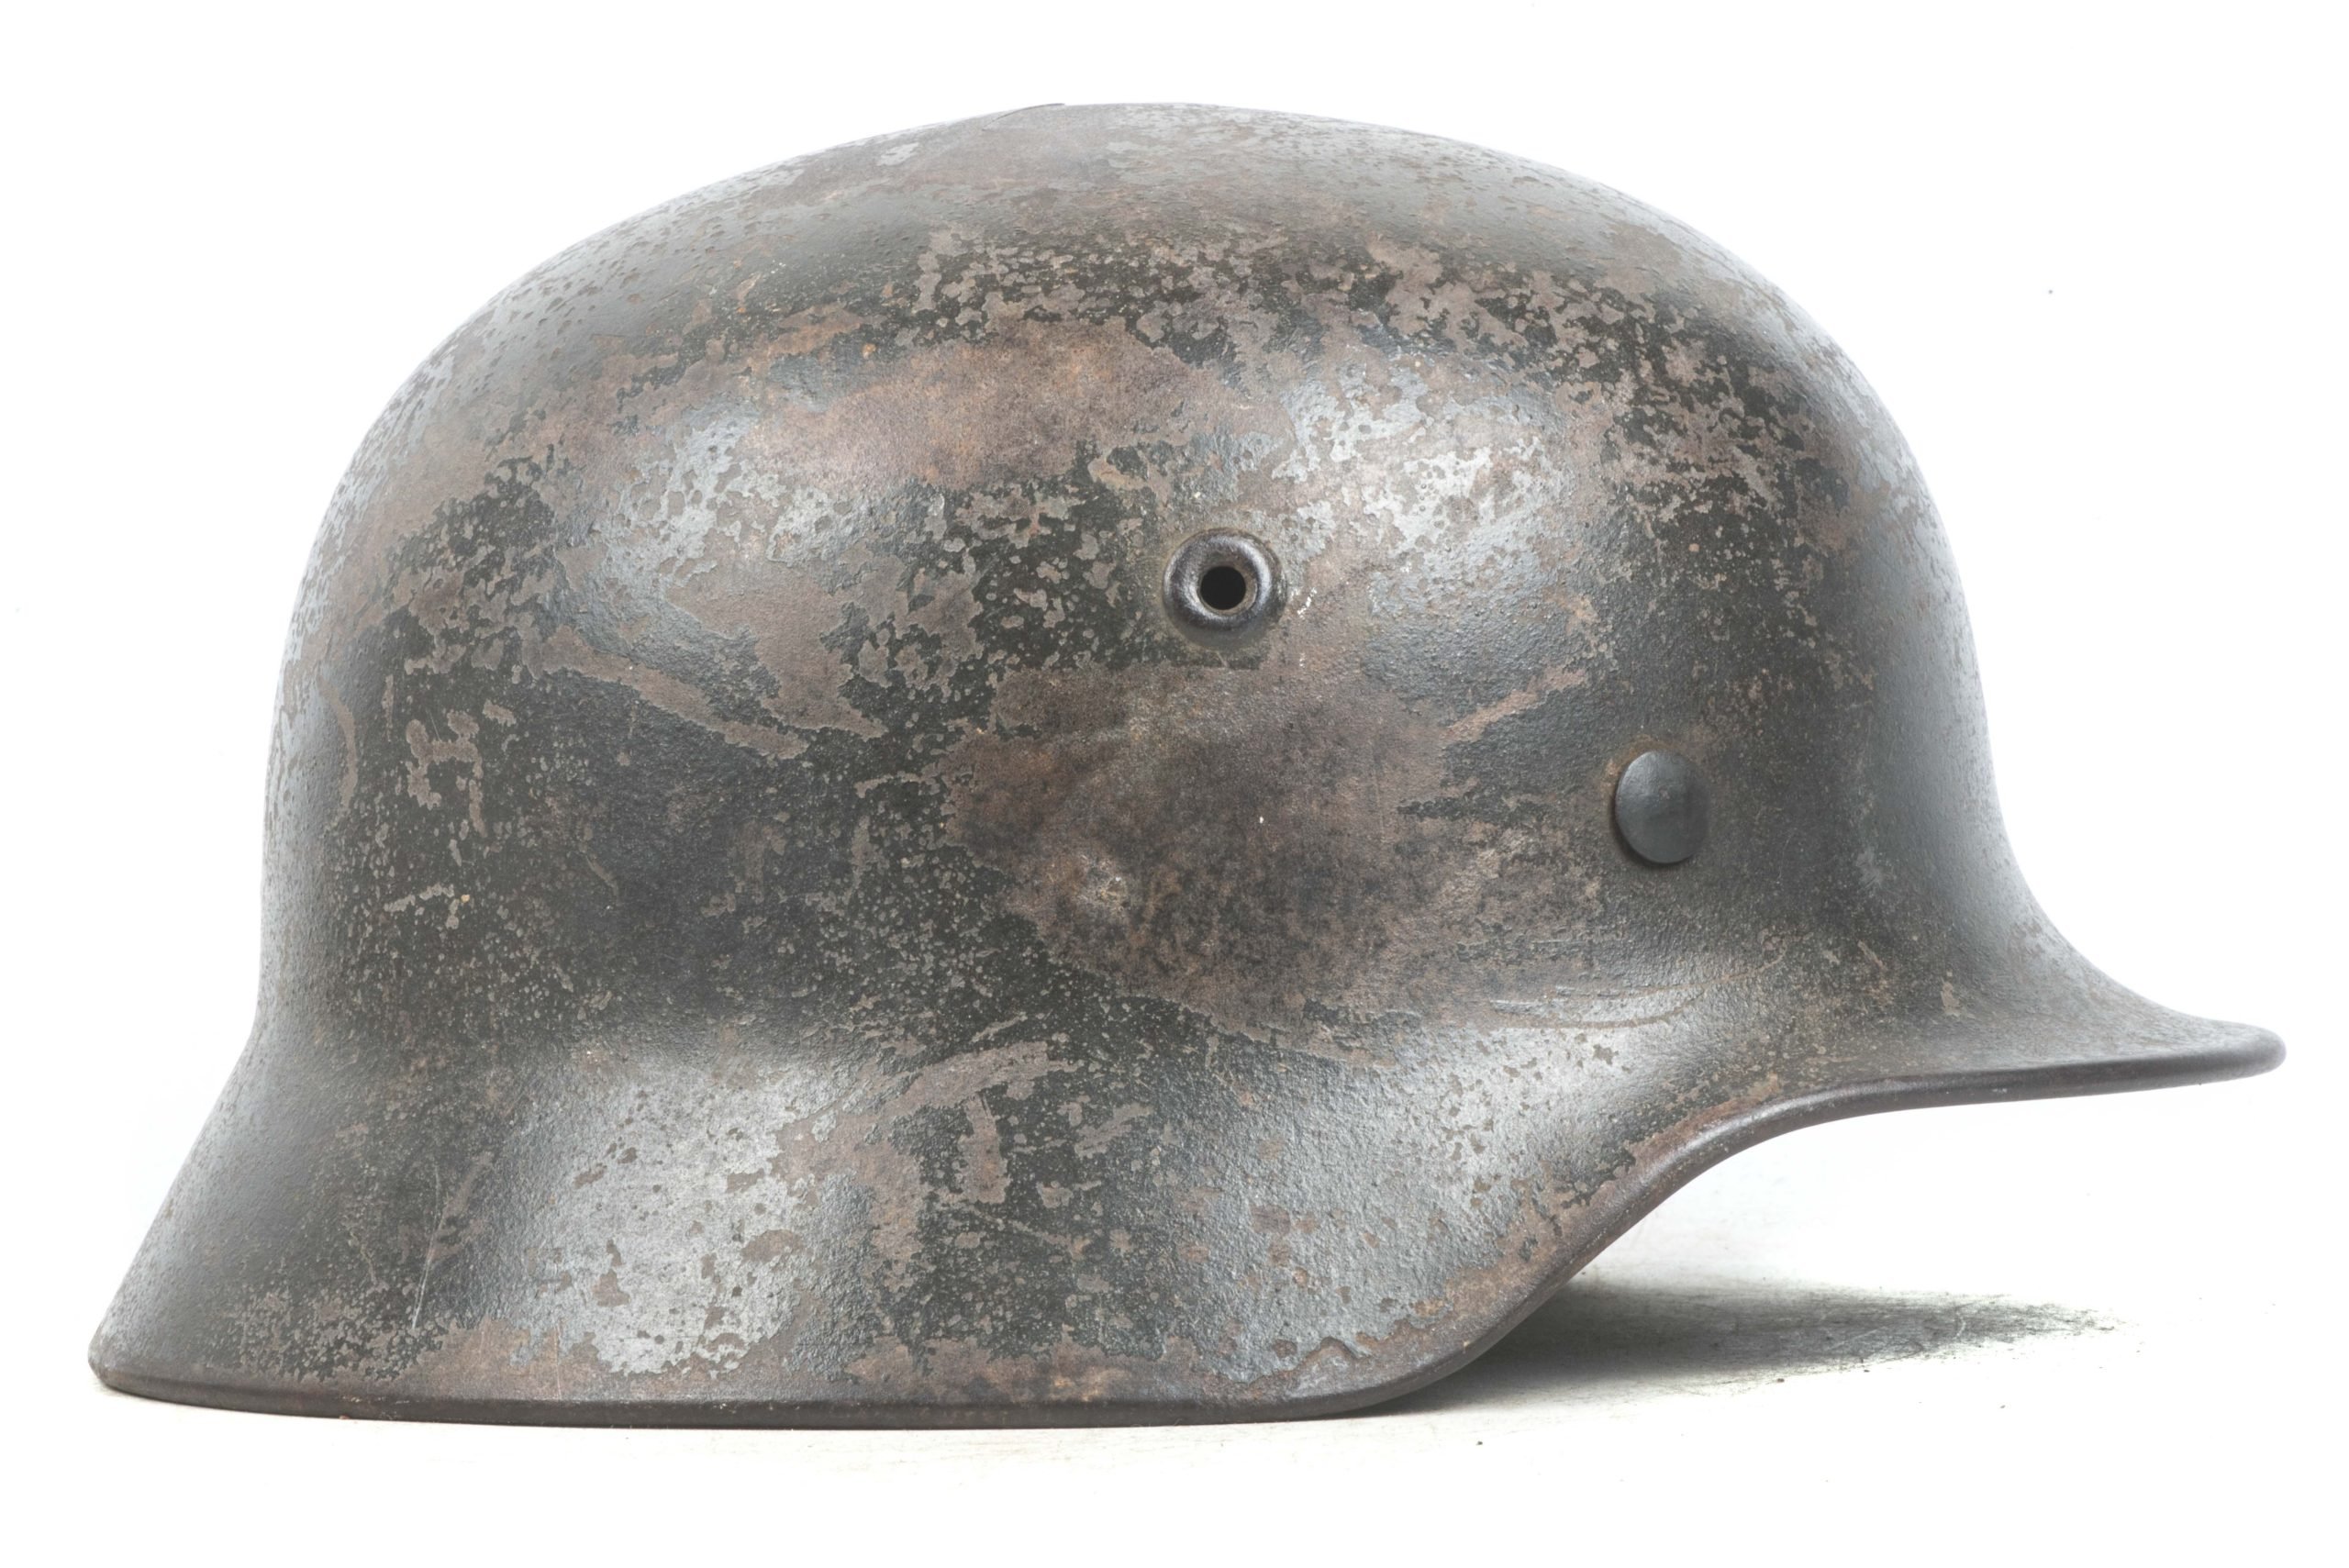
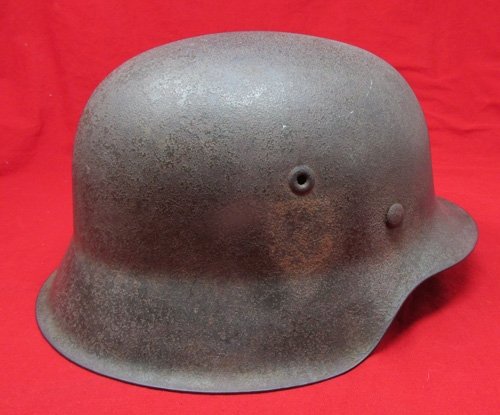
This market analysis focuses on straightforward, field used SS combat helmets: World War II single decal SS helmets with no camouflage paint, covers, netting, or wire. In other words, the classic steel helmet with a single SS runic shield on one side and a plain combat finish.
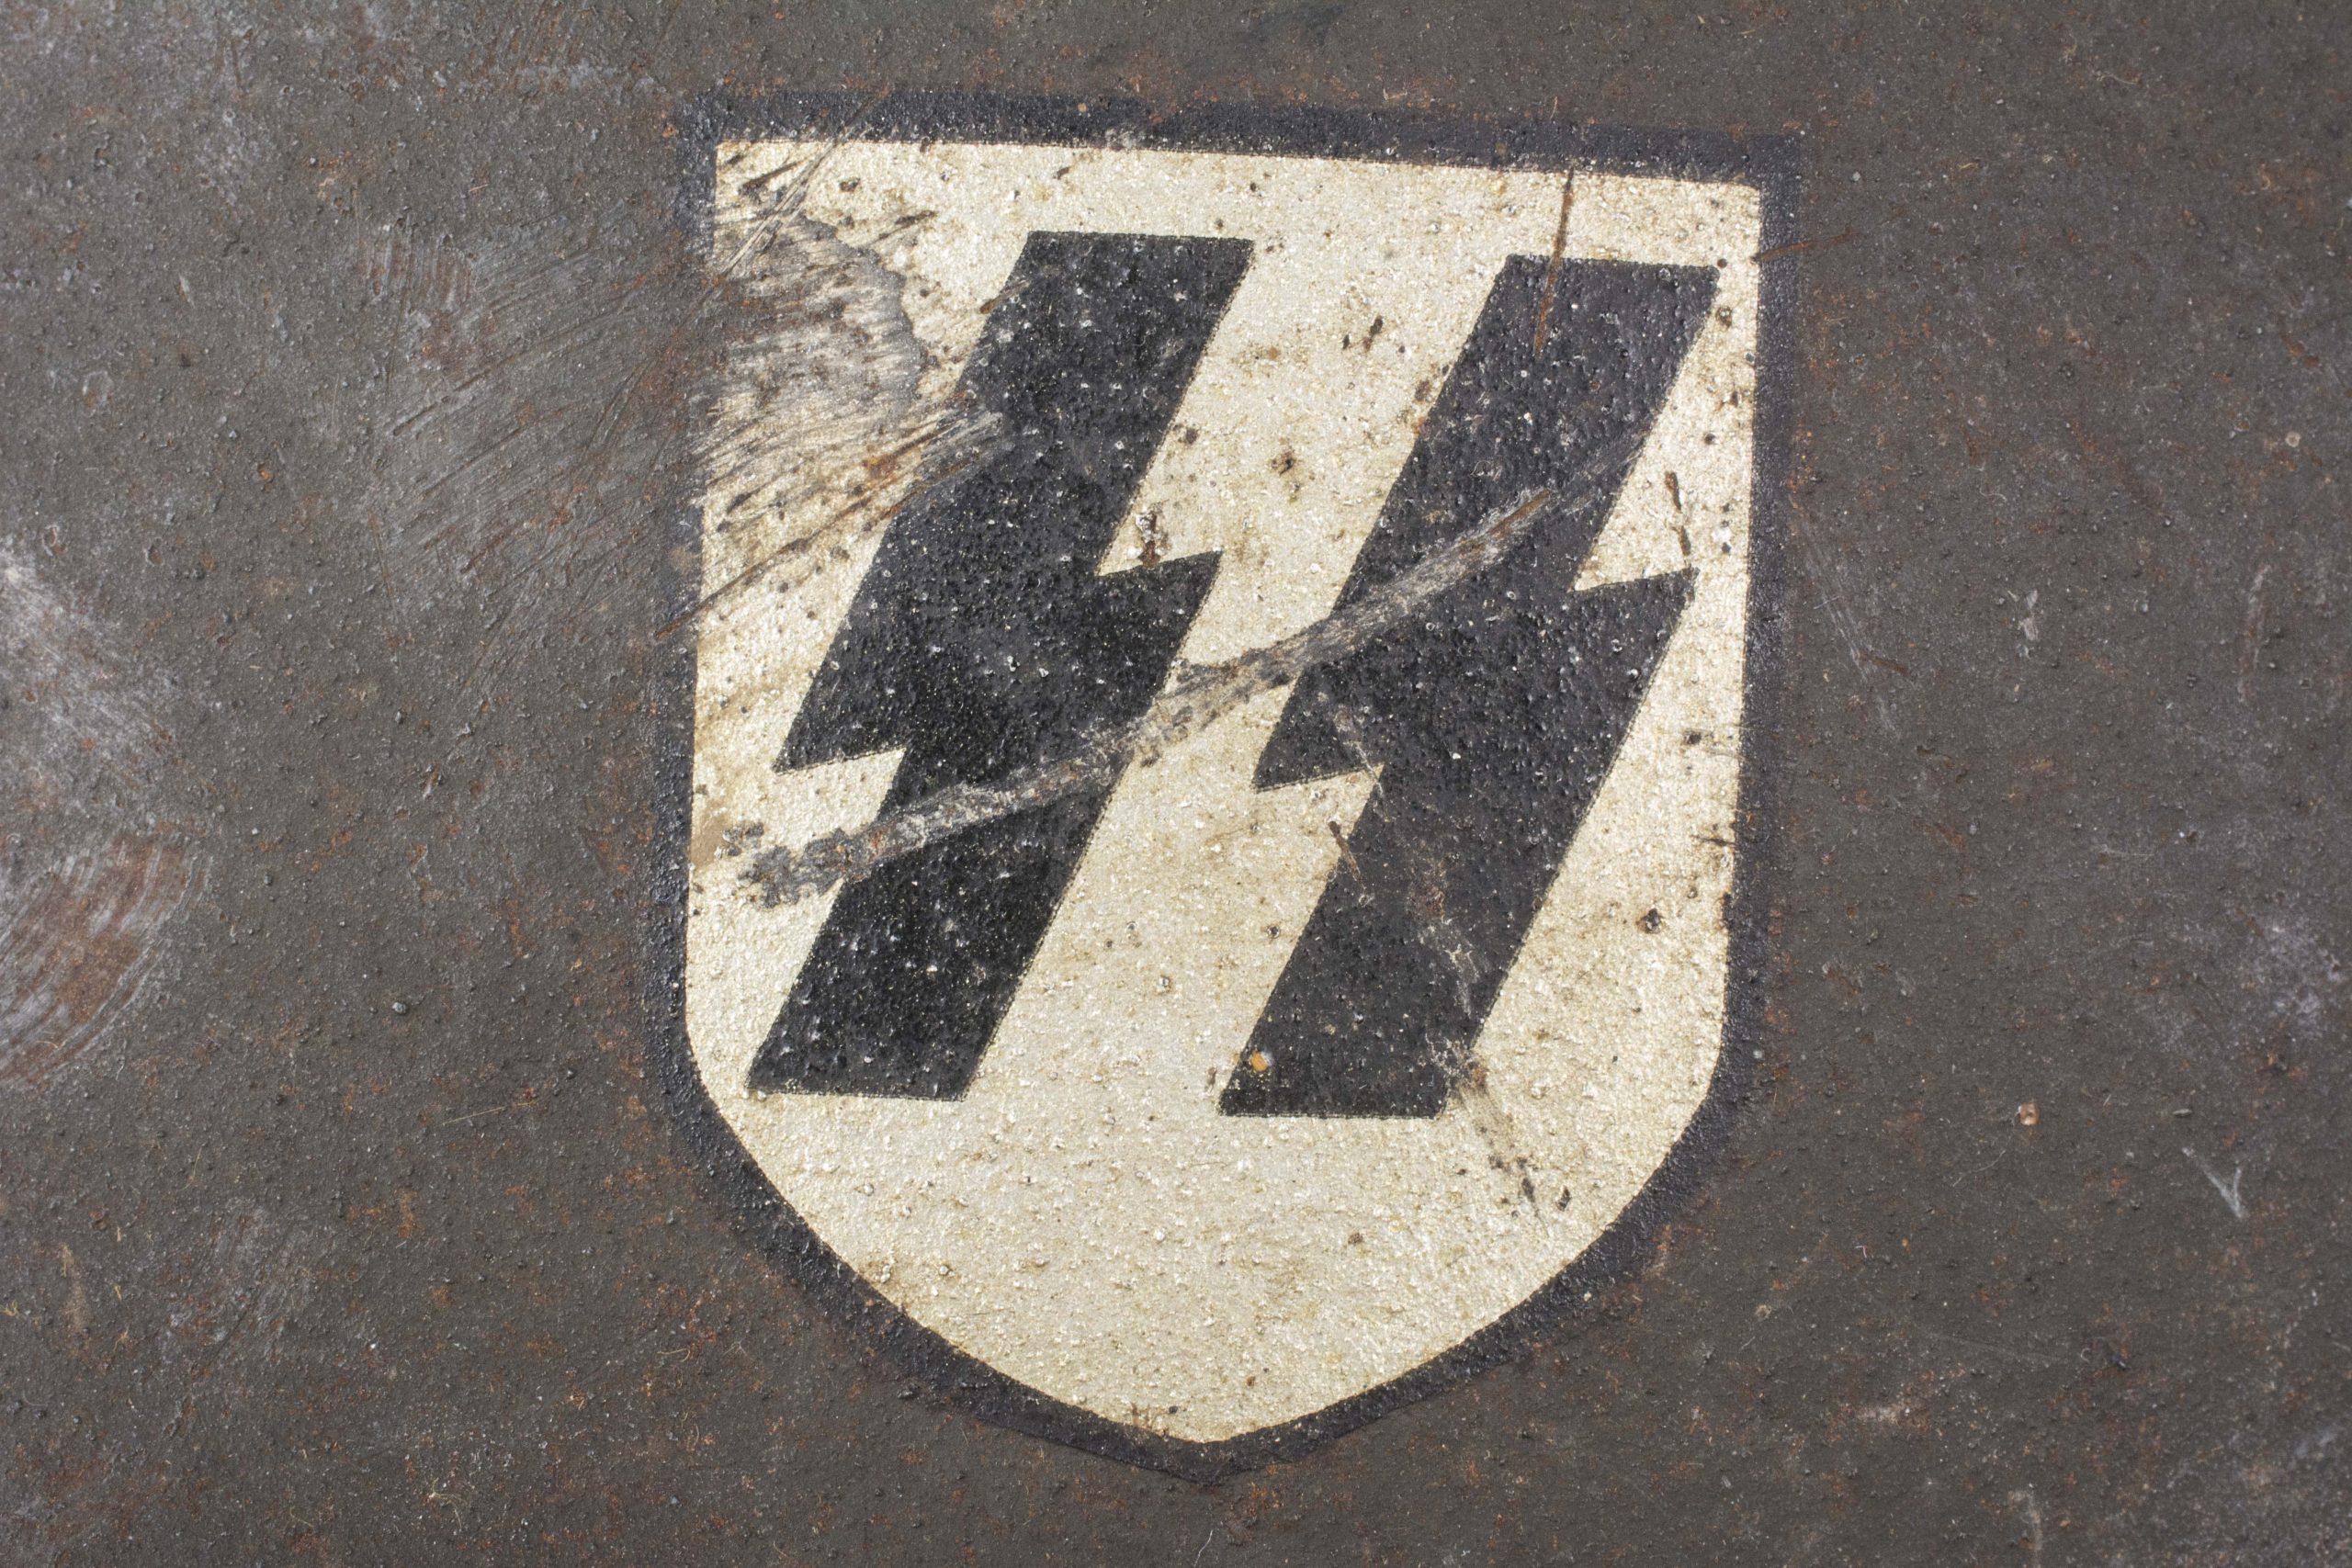
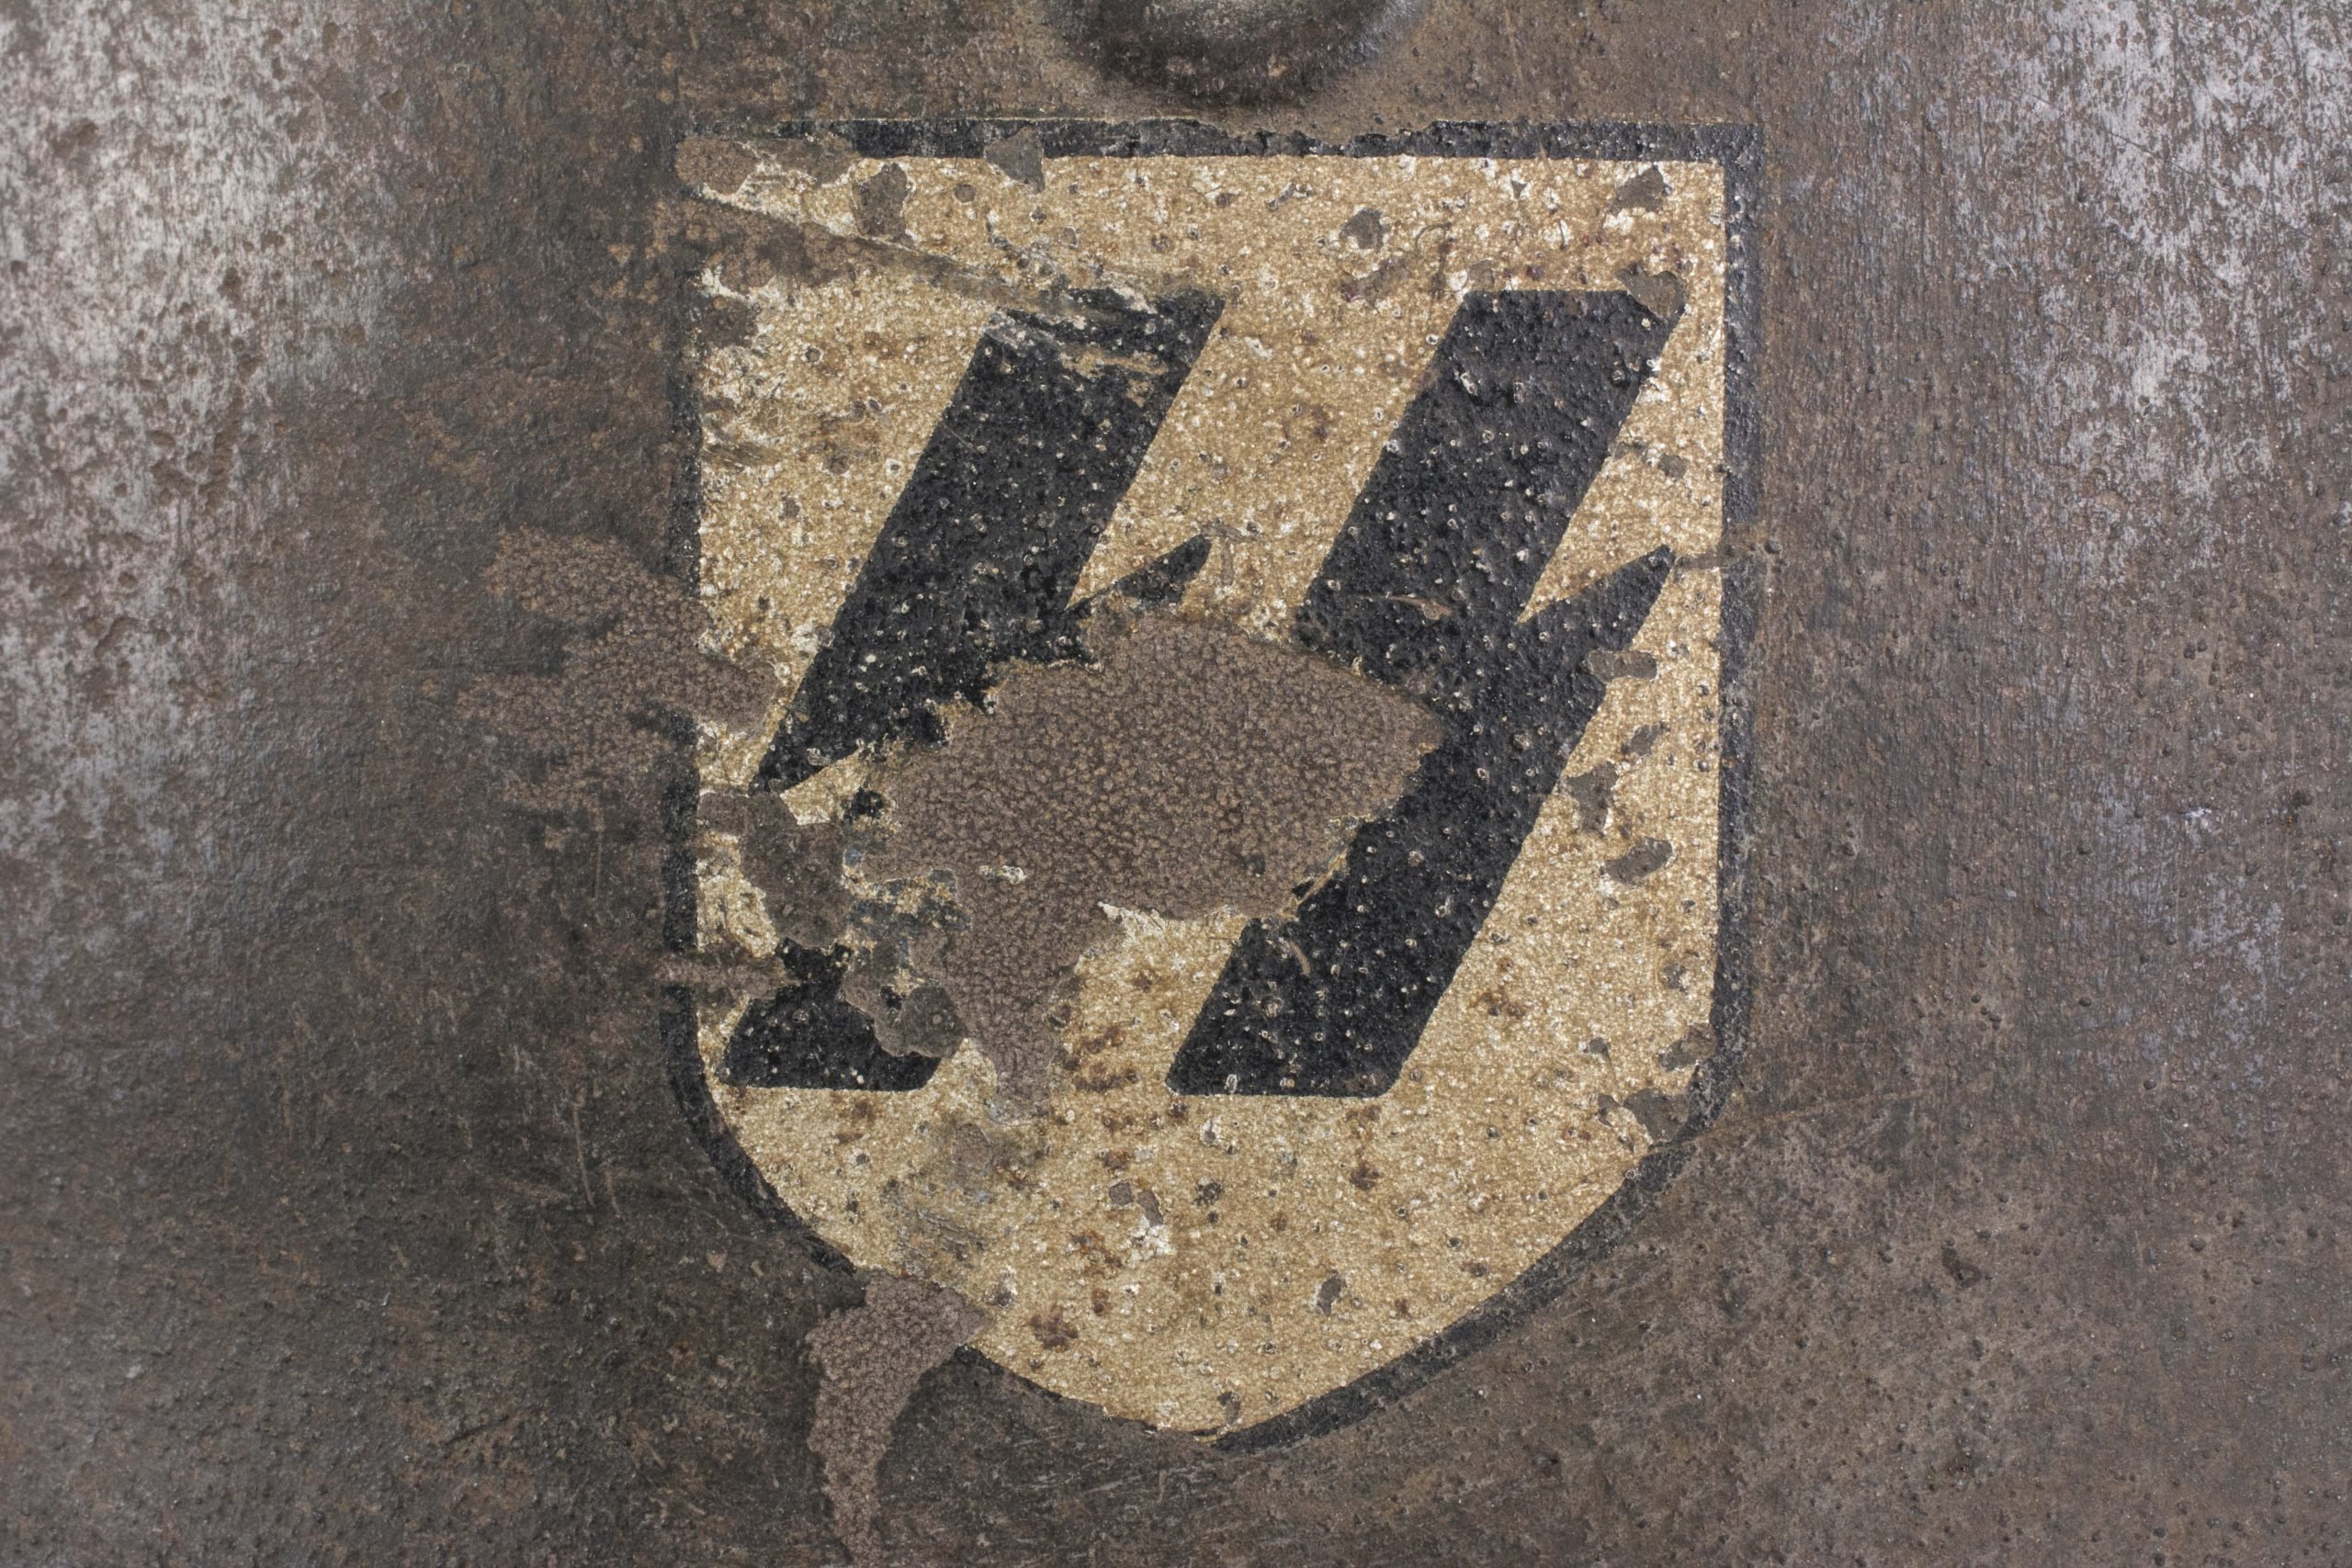
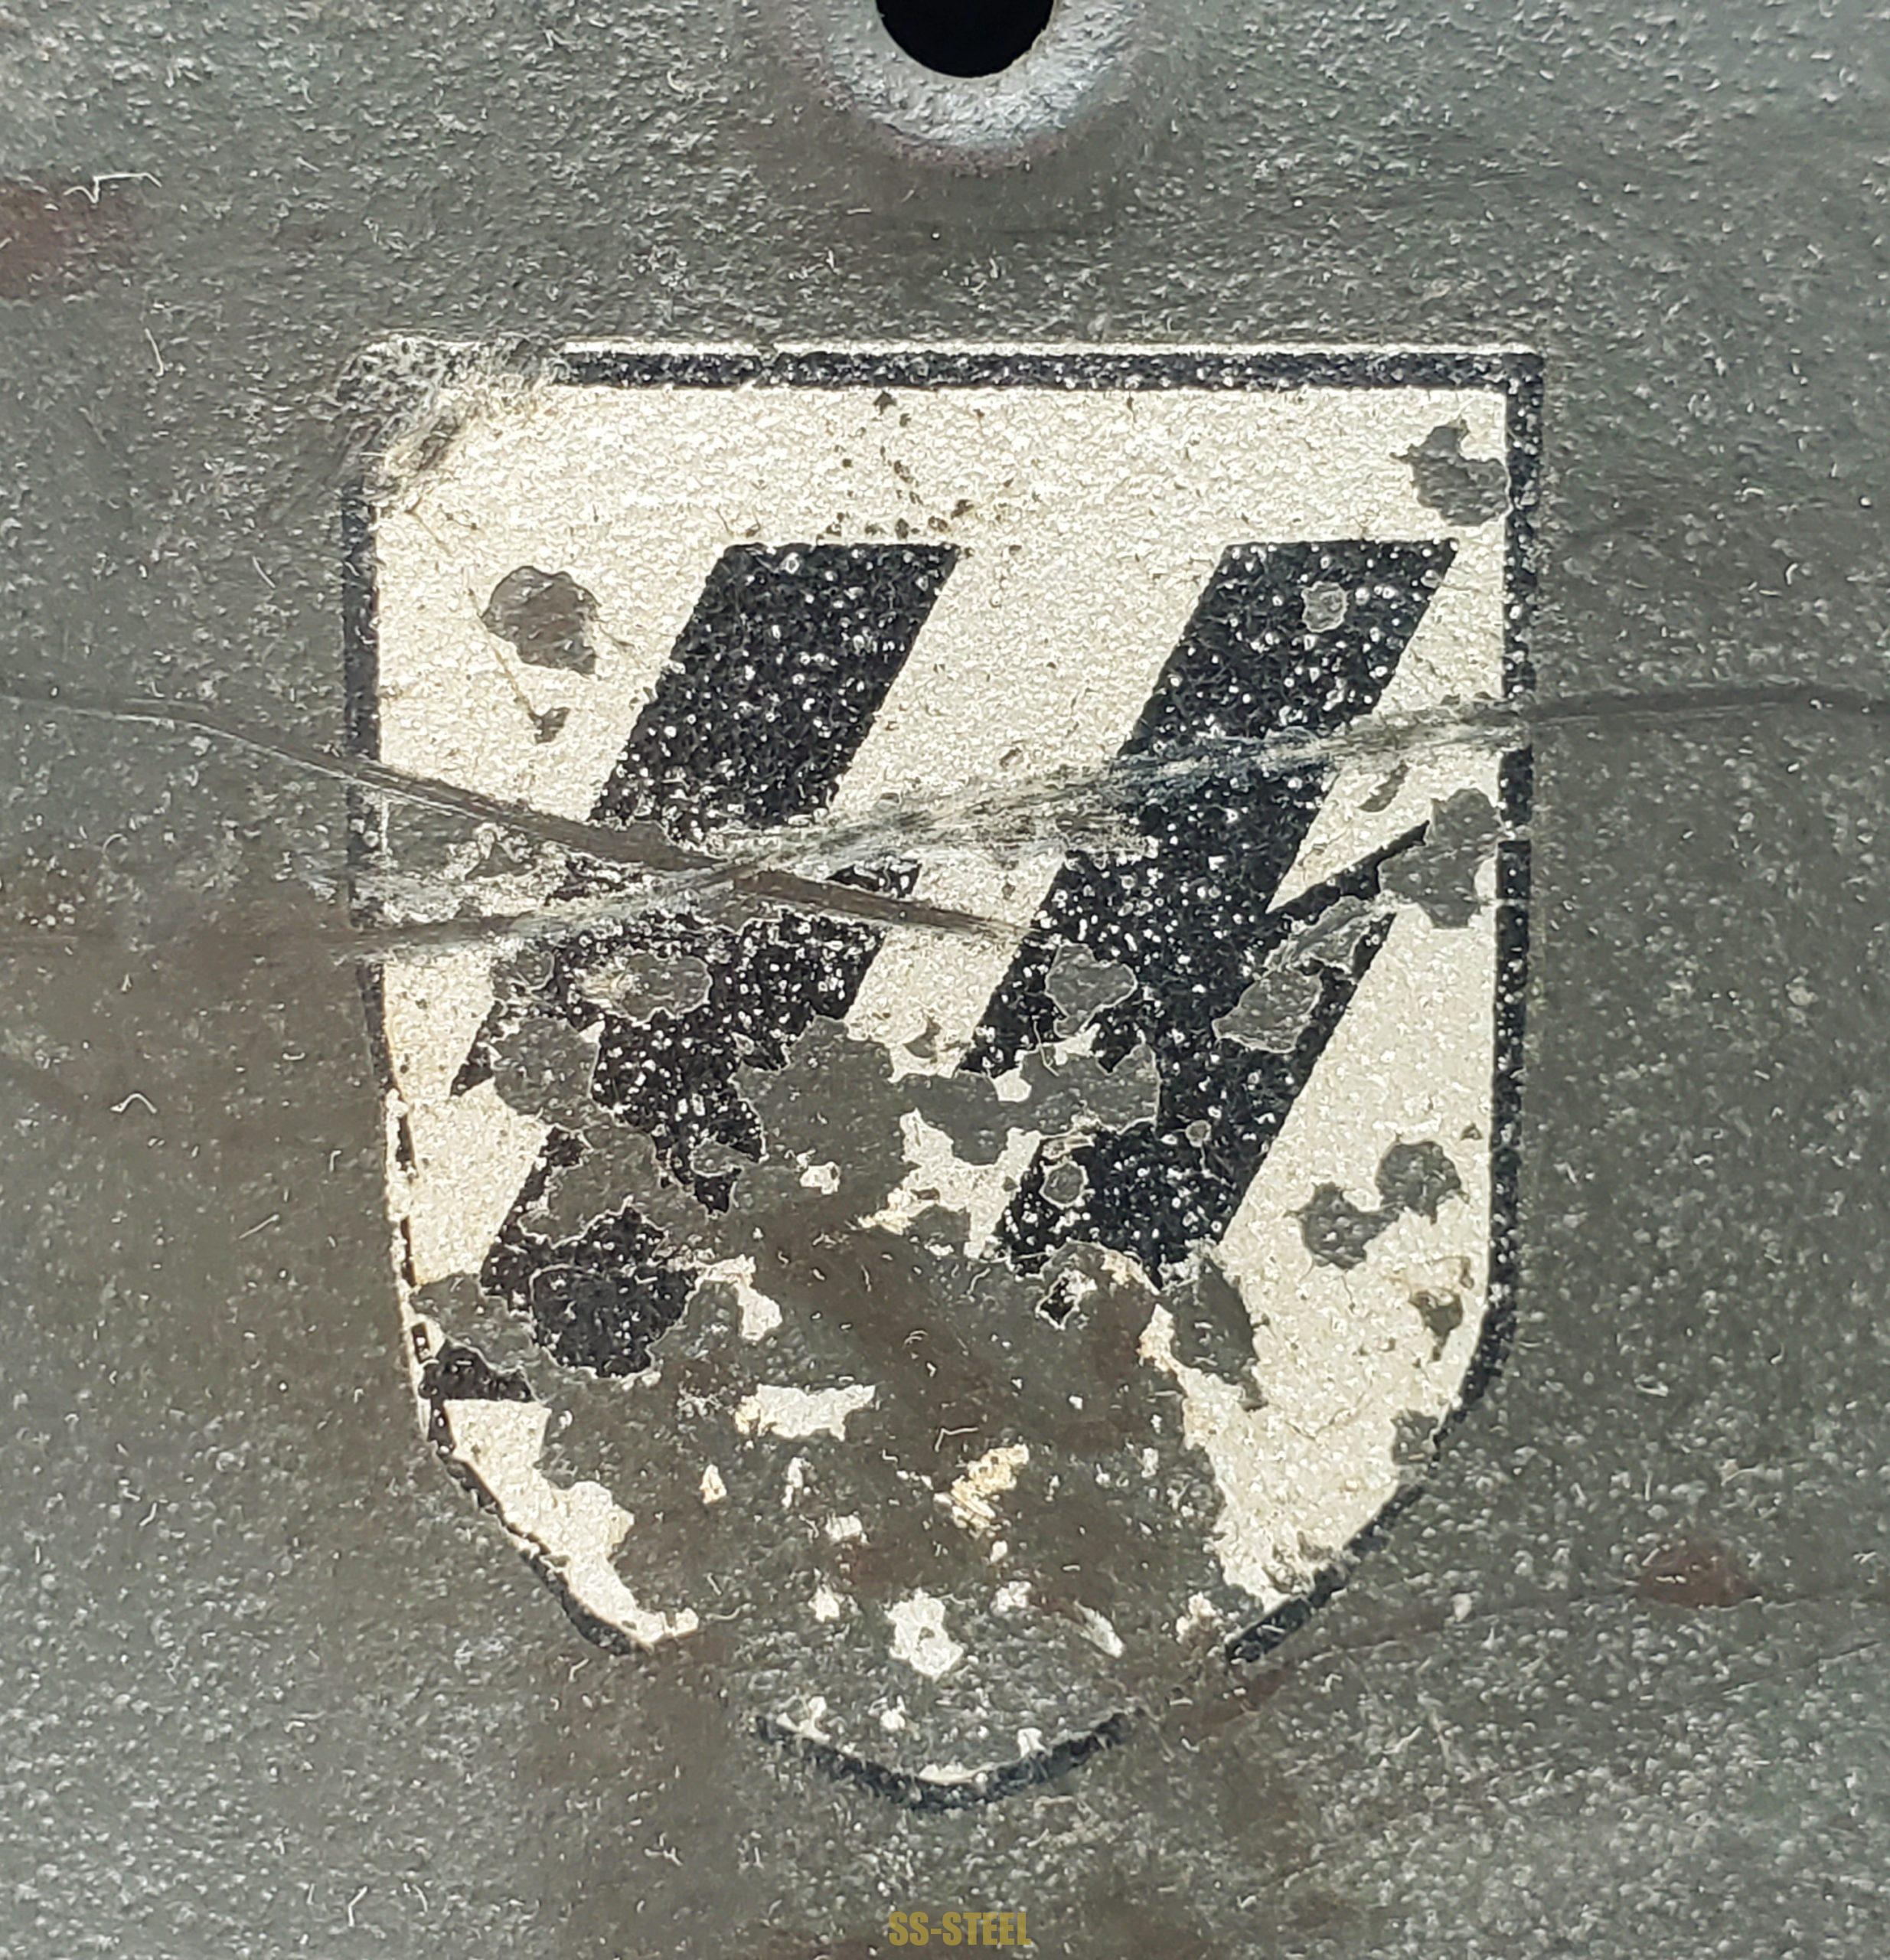
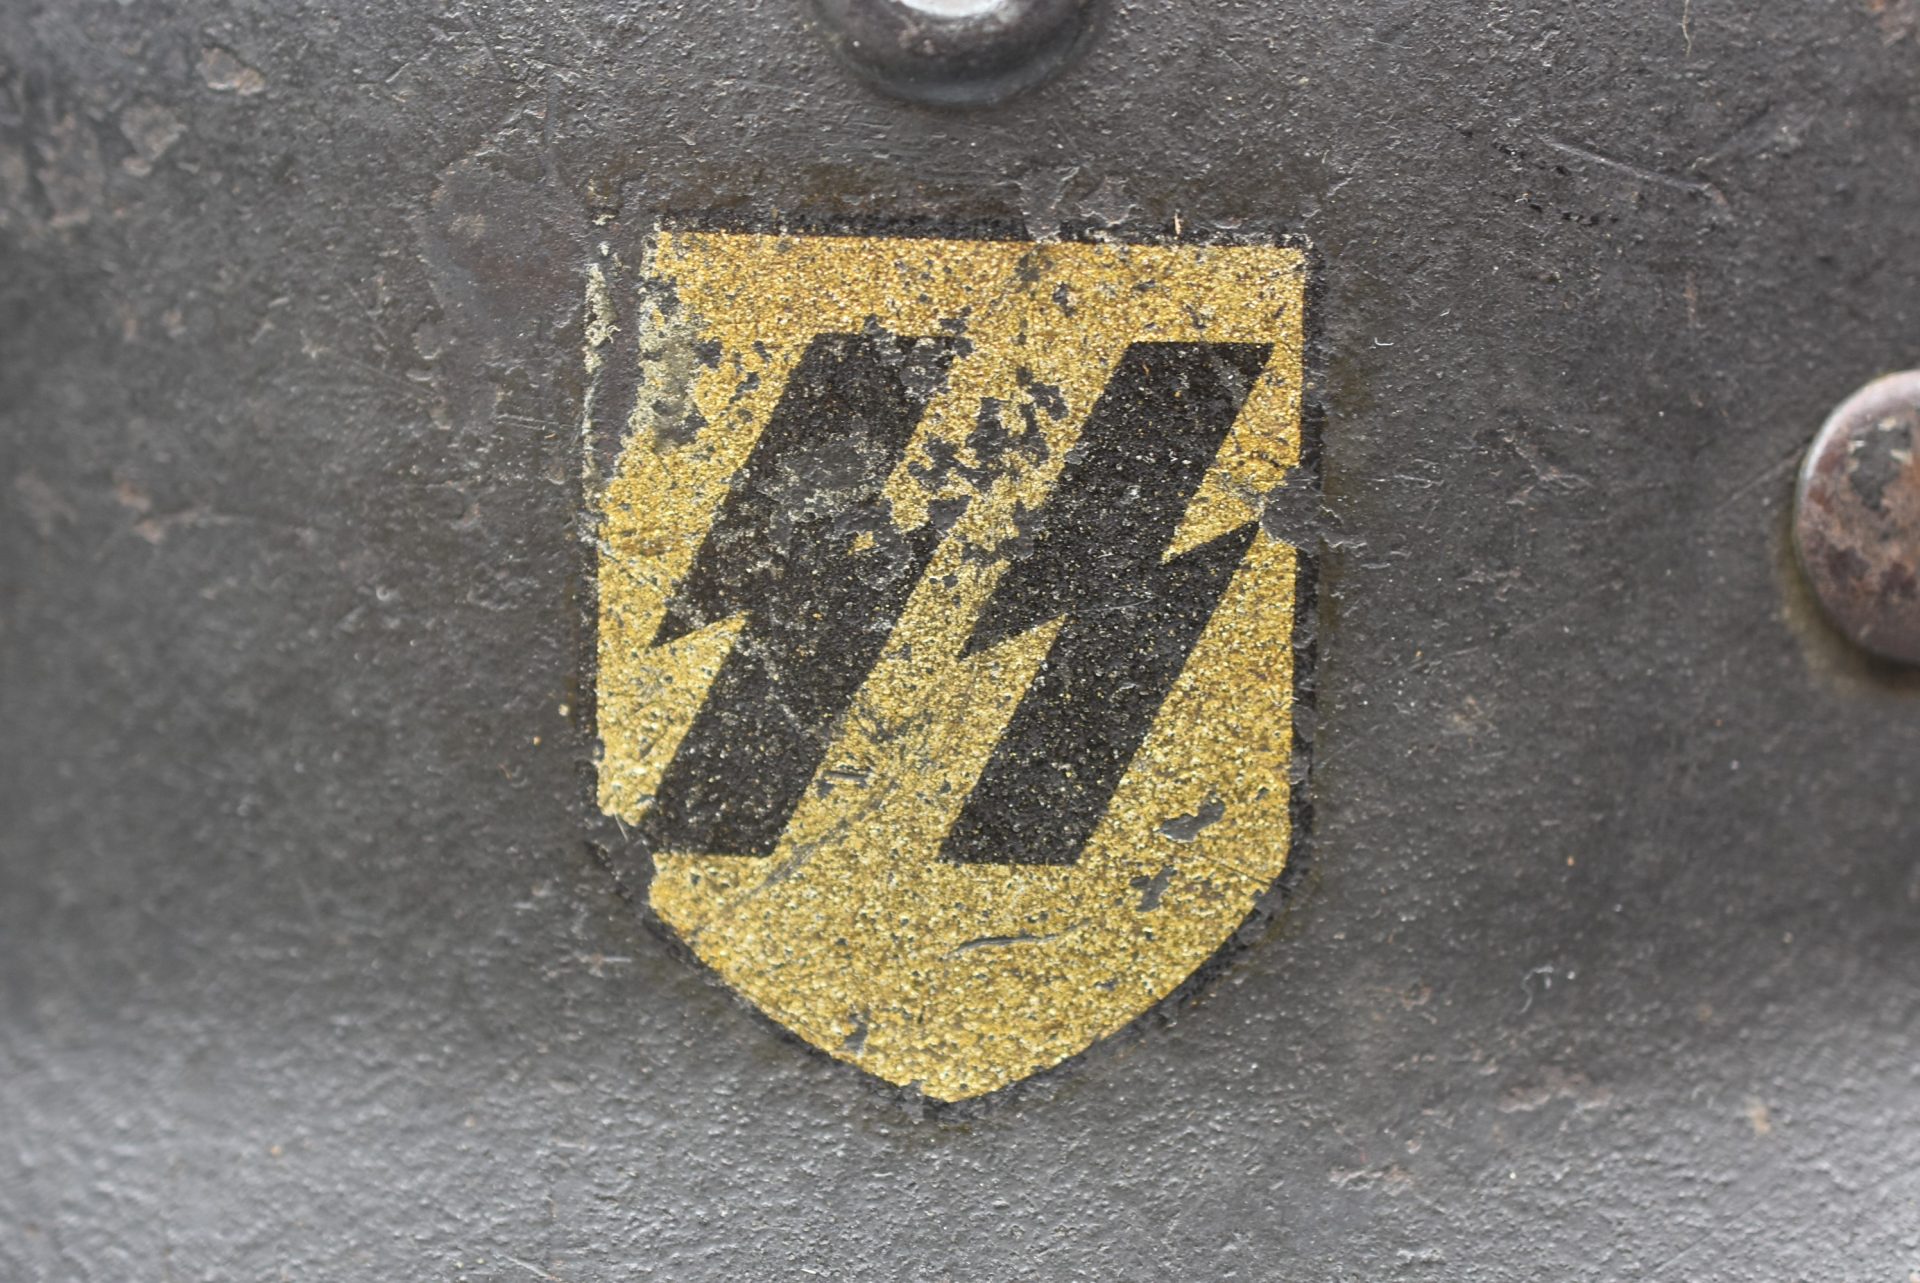
The SS started applying their distinctive runic shield to steel helmets in the mid 1930s. Early helmets often carried two decals, SS runes on one side and a party or national shield on the other, before regulations gradually toned things down. The party or swastika shield was officially dropped around 1940, and production of runic shields was discontinued in late 1943. In reality, these helmets stayed in service right through to the end of the war and beyond as battlefield souvenirs.
Technically, the SS combat helmets followed the same basic evolution as the regular army: M35, then M40, then M42. Paint colors were basically the same as Heer and the other branches. What really drives collectors crazy are the details on top of that, such as maker, lot number, decal style, and small production quirks, rather than some special SS only shell. Those nuances absolutely affect value, but for this study we are using them as context, not as the primary filter.
From Background to Market Analysis: What This Analysis Actually Does
For this market analysis, I have deliberately narrowed the scope to a baseline SS combat helmet: a World War II single decal SS helmet with no camouflage or extra additions. There are no paratrooper helmets, no reworked Czech shells, and no wire “Normandy” fantasy setups. The focus is on standard SS combat helmets as they were worn in the field. Within that slice, I break the market down by condition tiers and compare two things for each tier:
-What dealers are asking
-What our model assesses as a fair value
All of the condition labels and scores used here were done manually by me, not by AI or any automated system. I went through each helmet one by one, looked closely at the photos, read the descriptions, and assigned rankings based on my own judgment. These are my opinions, not a community consensus or some hidden objective truth.
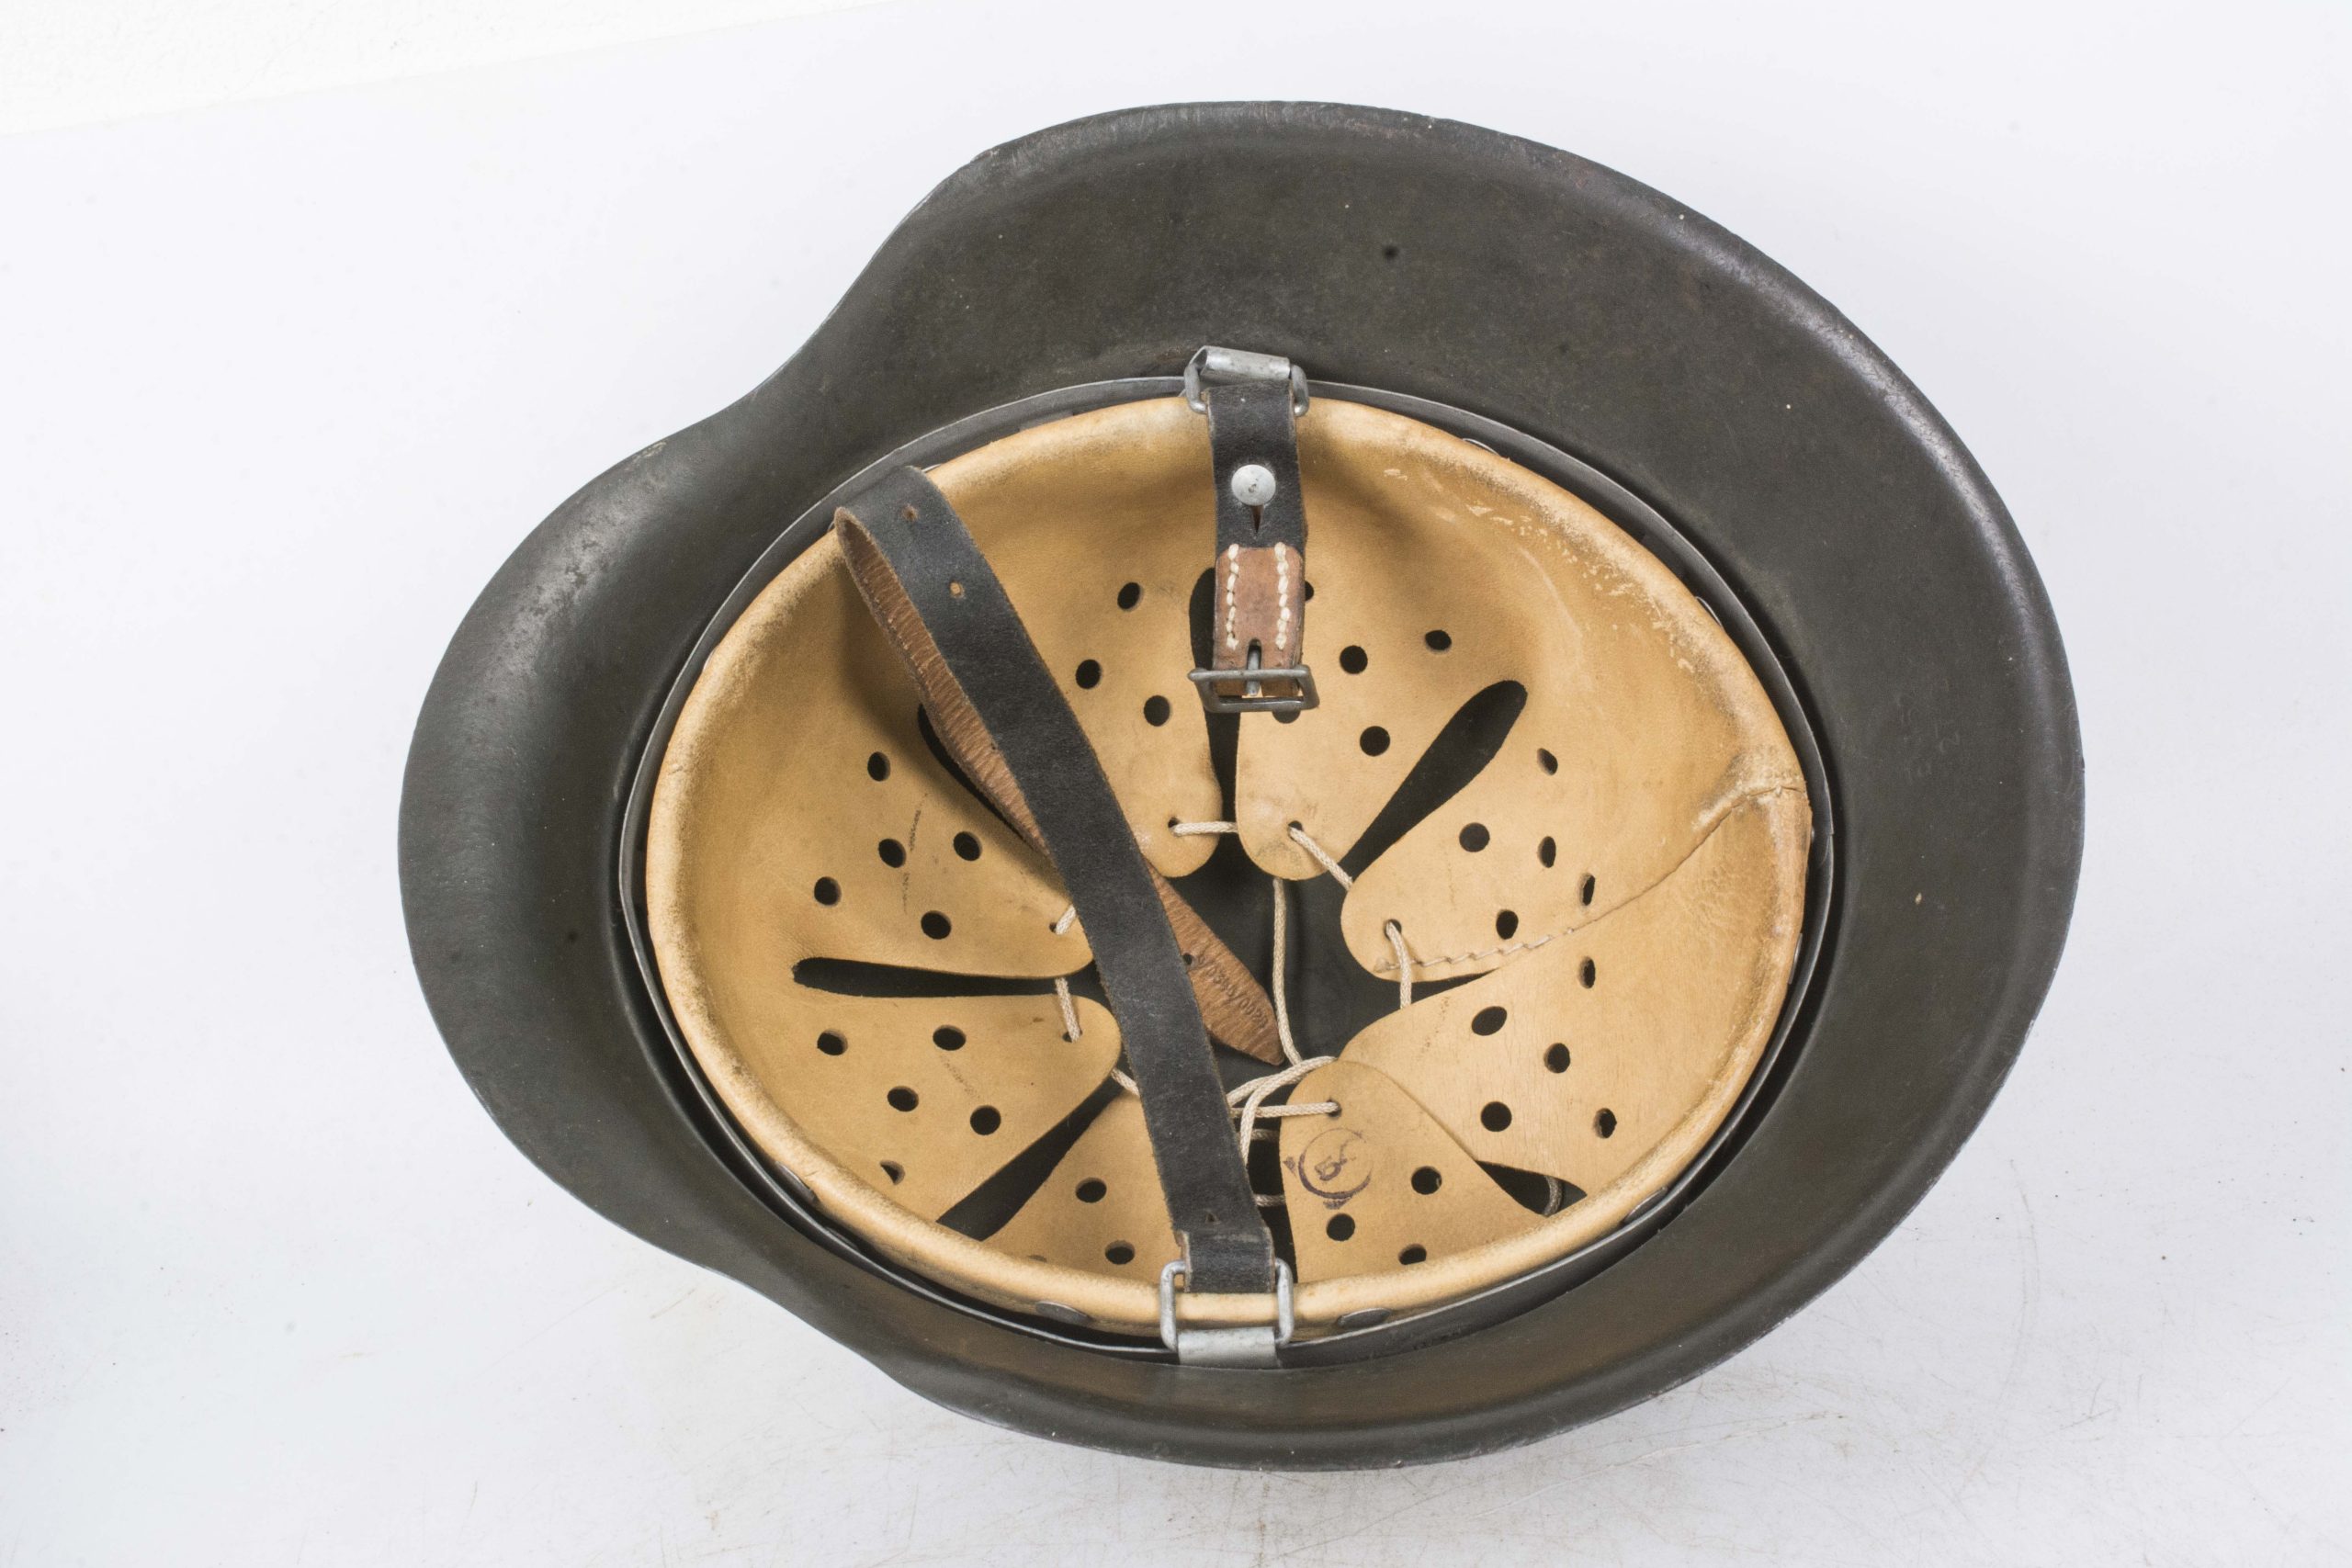
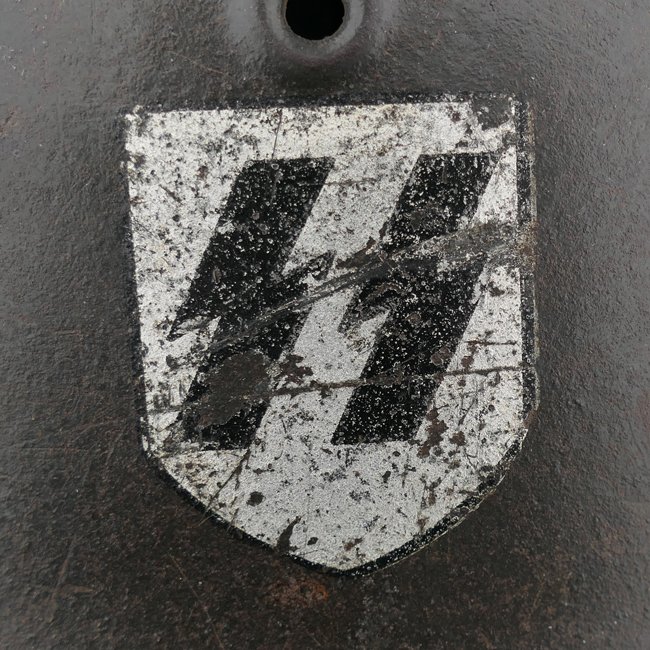
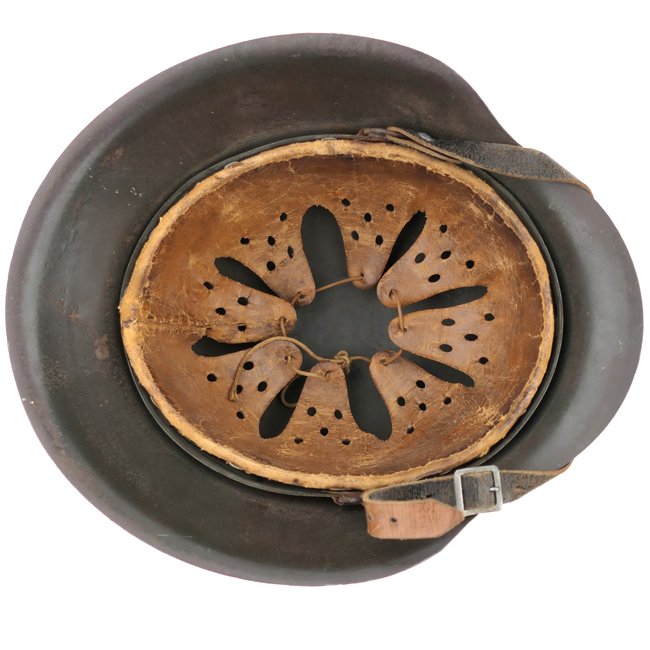
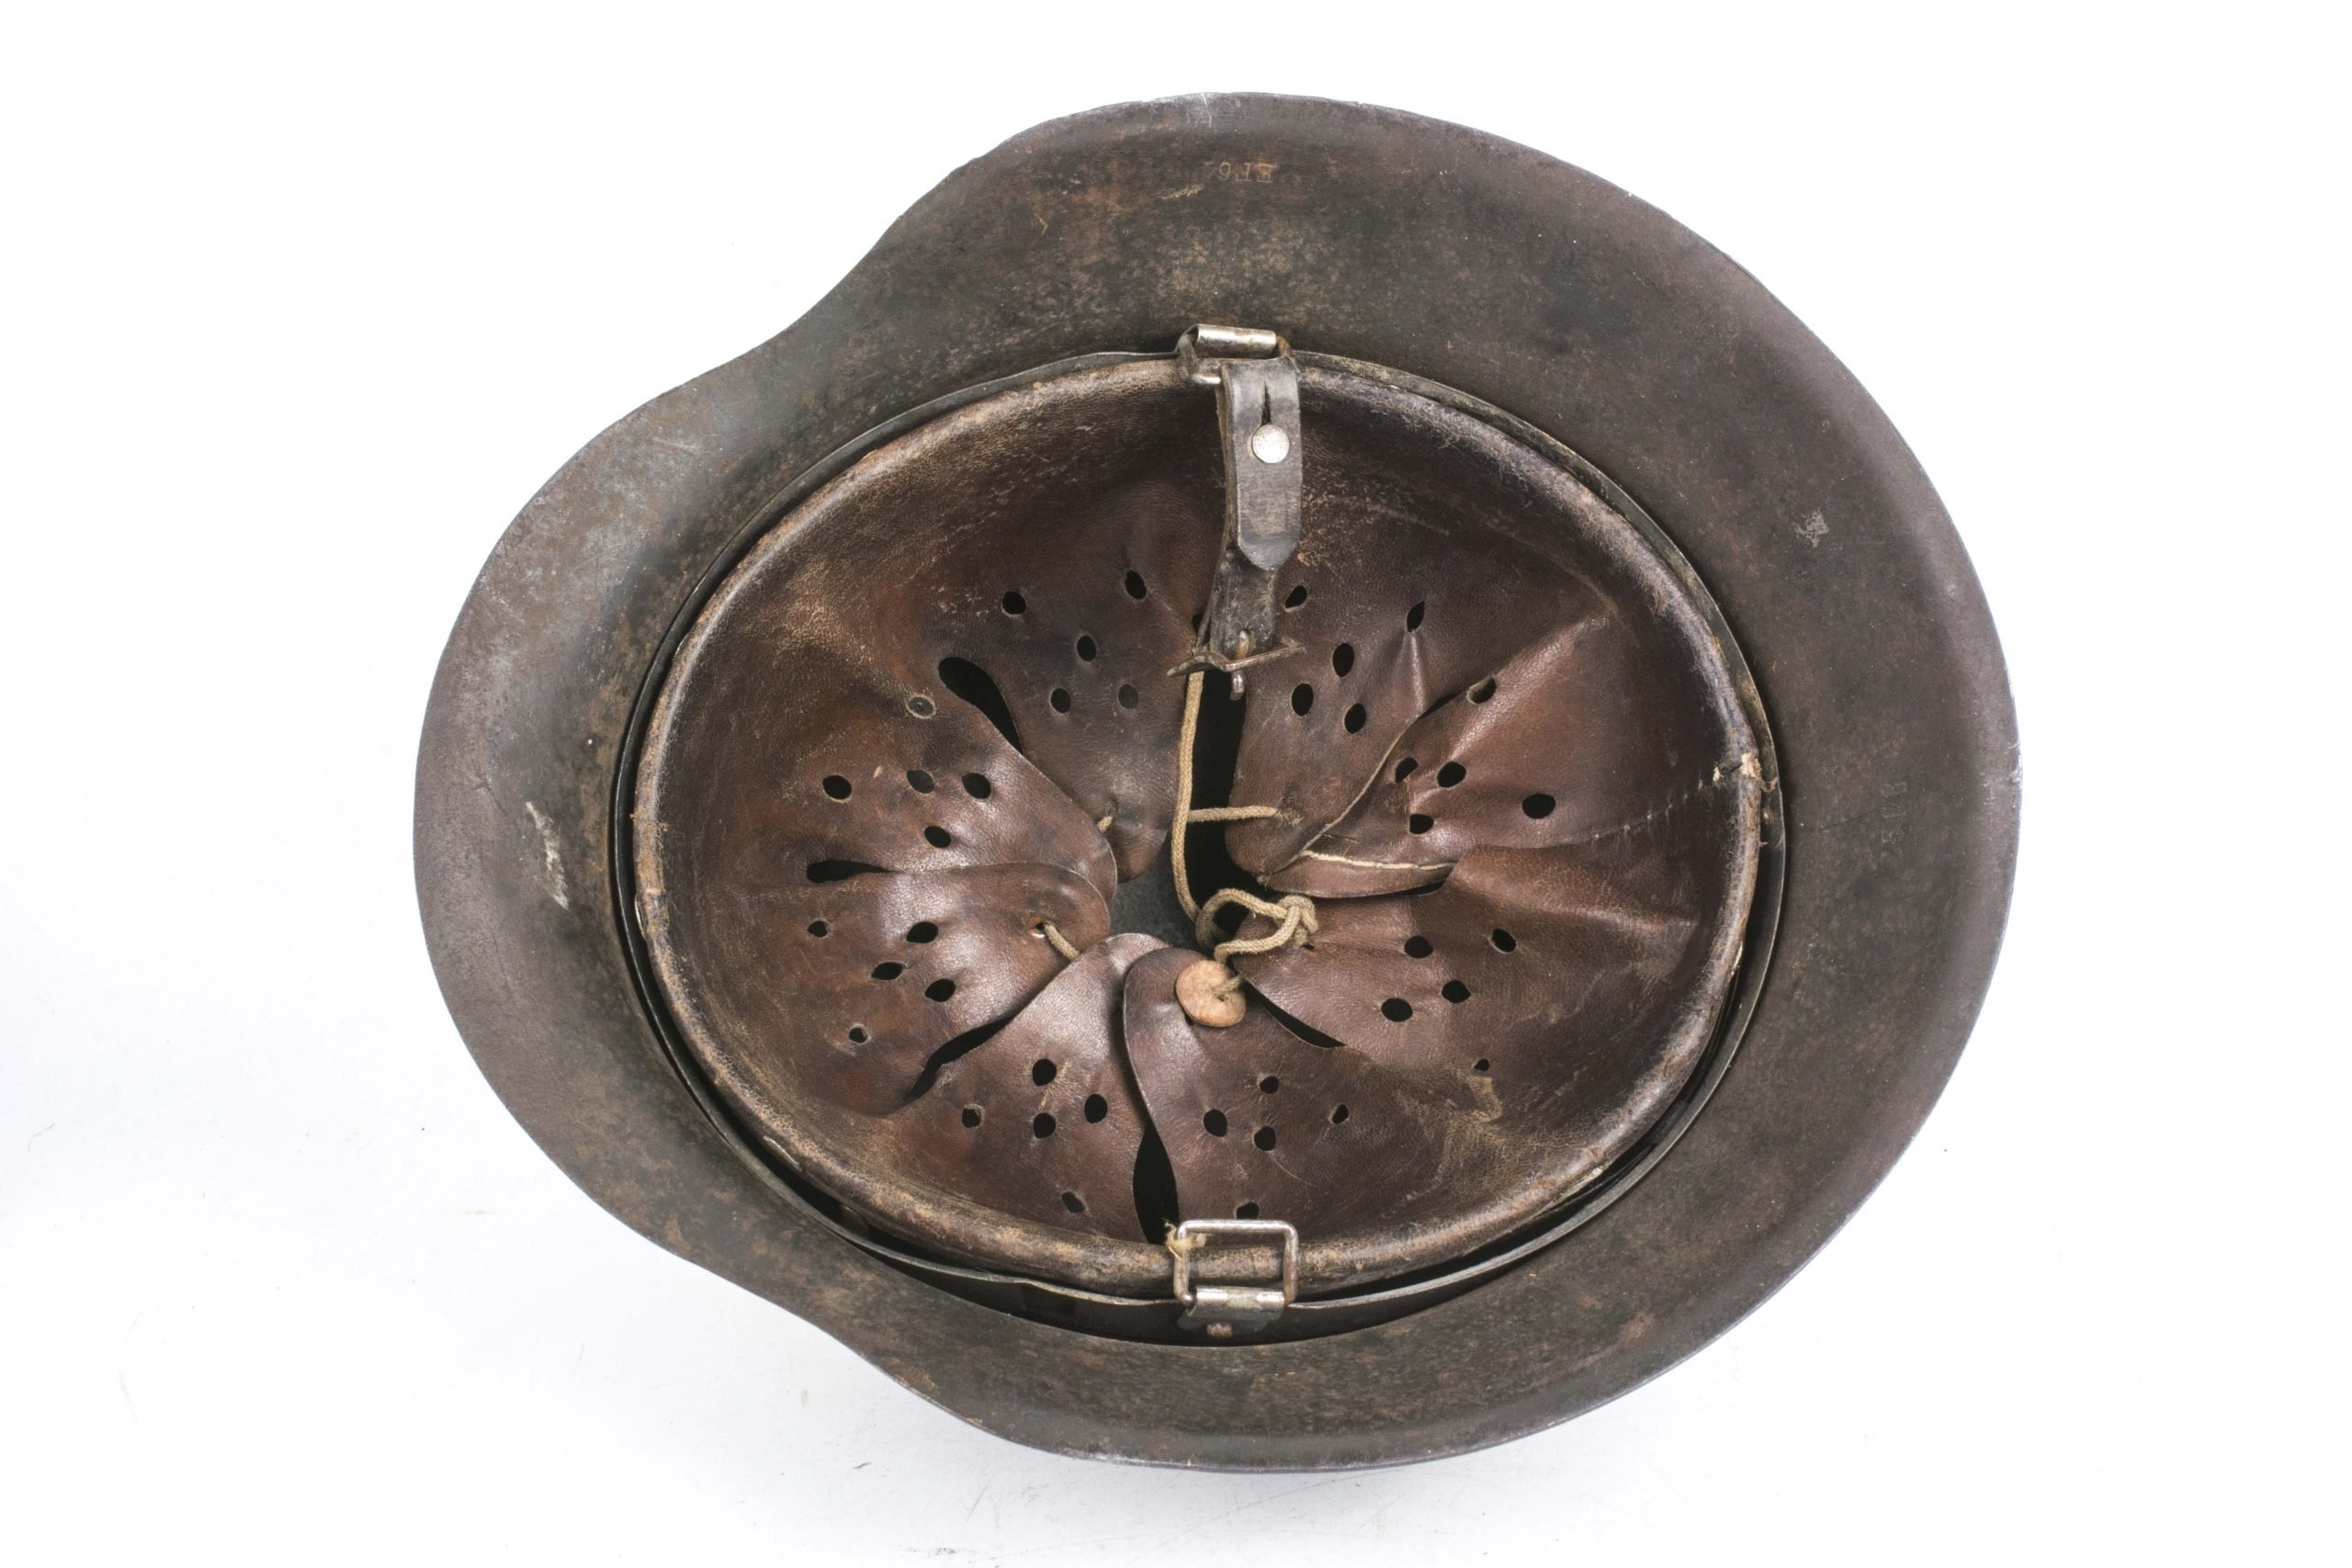
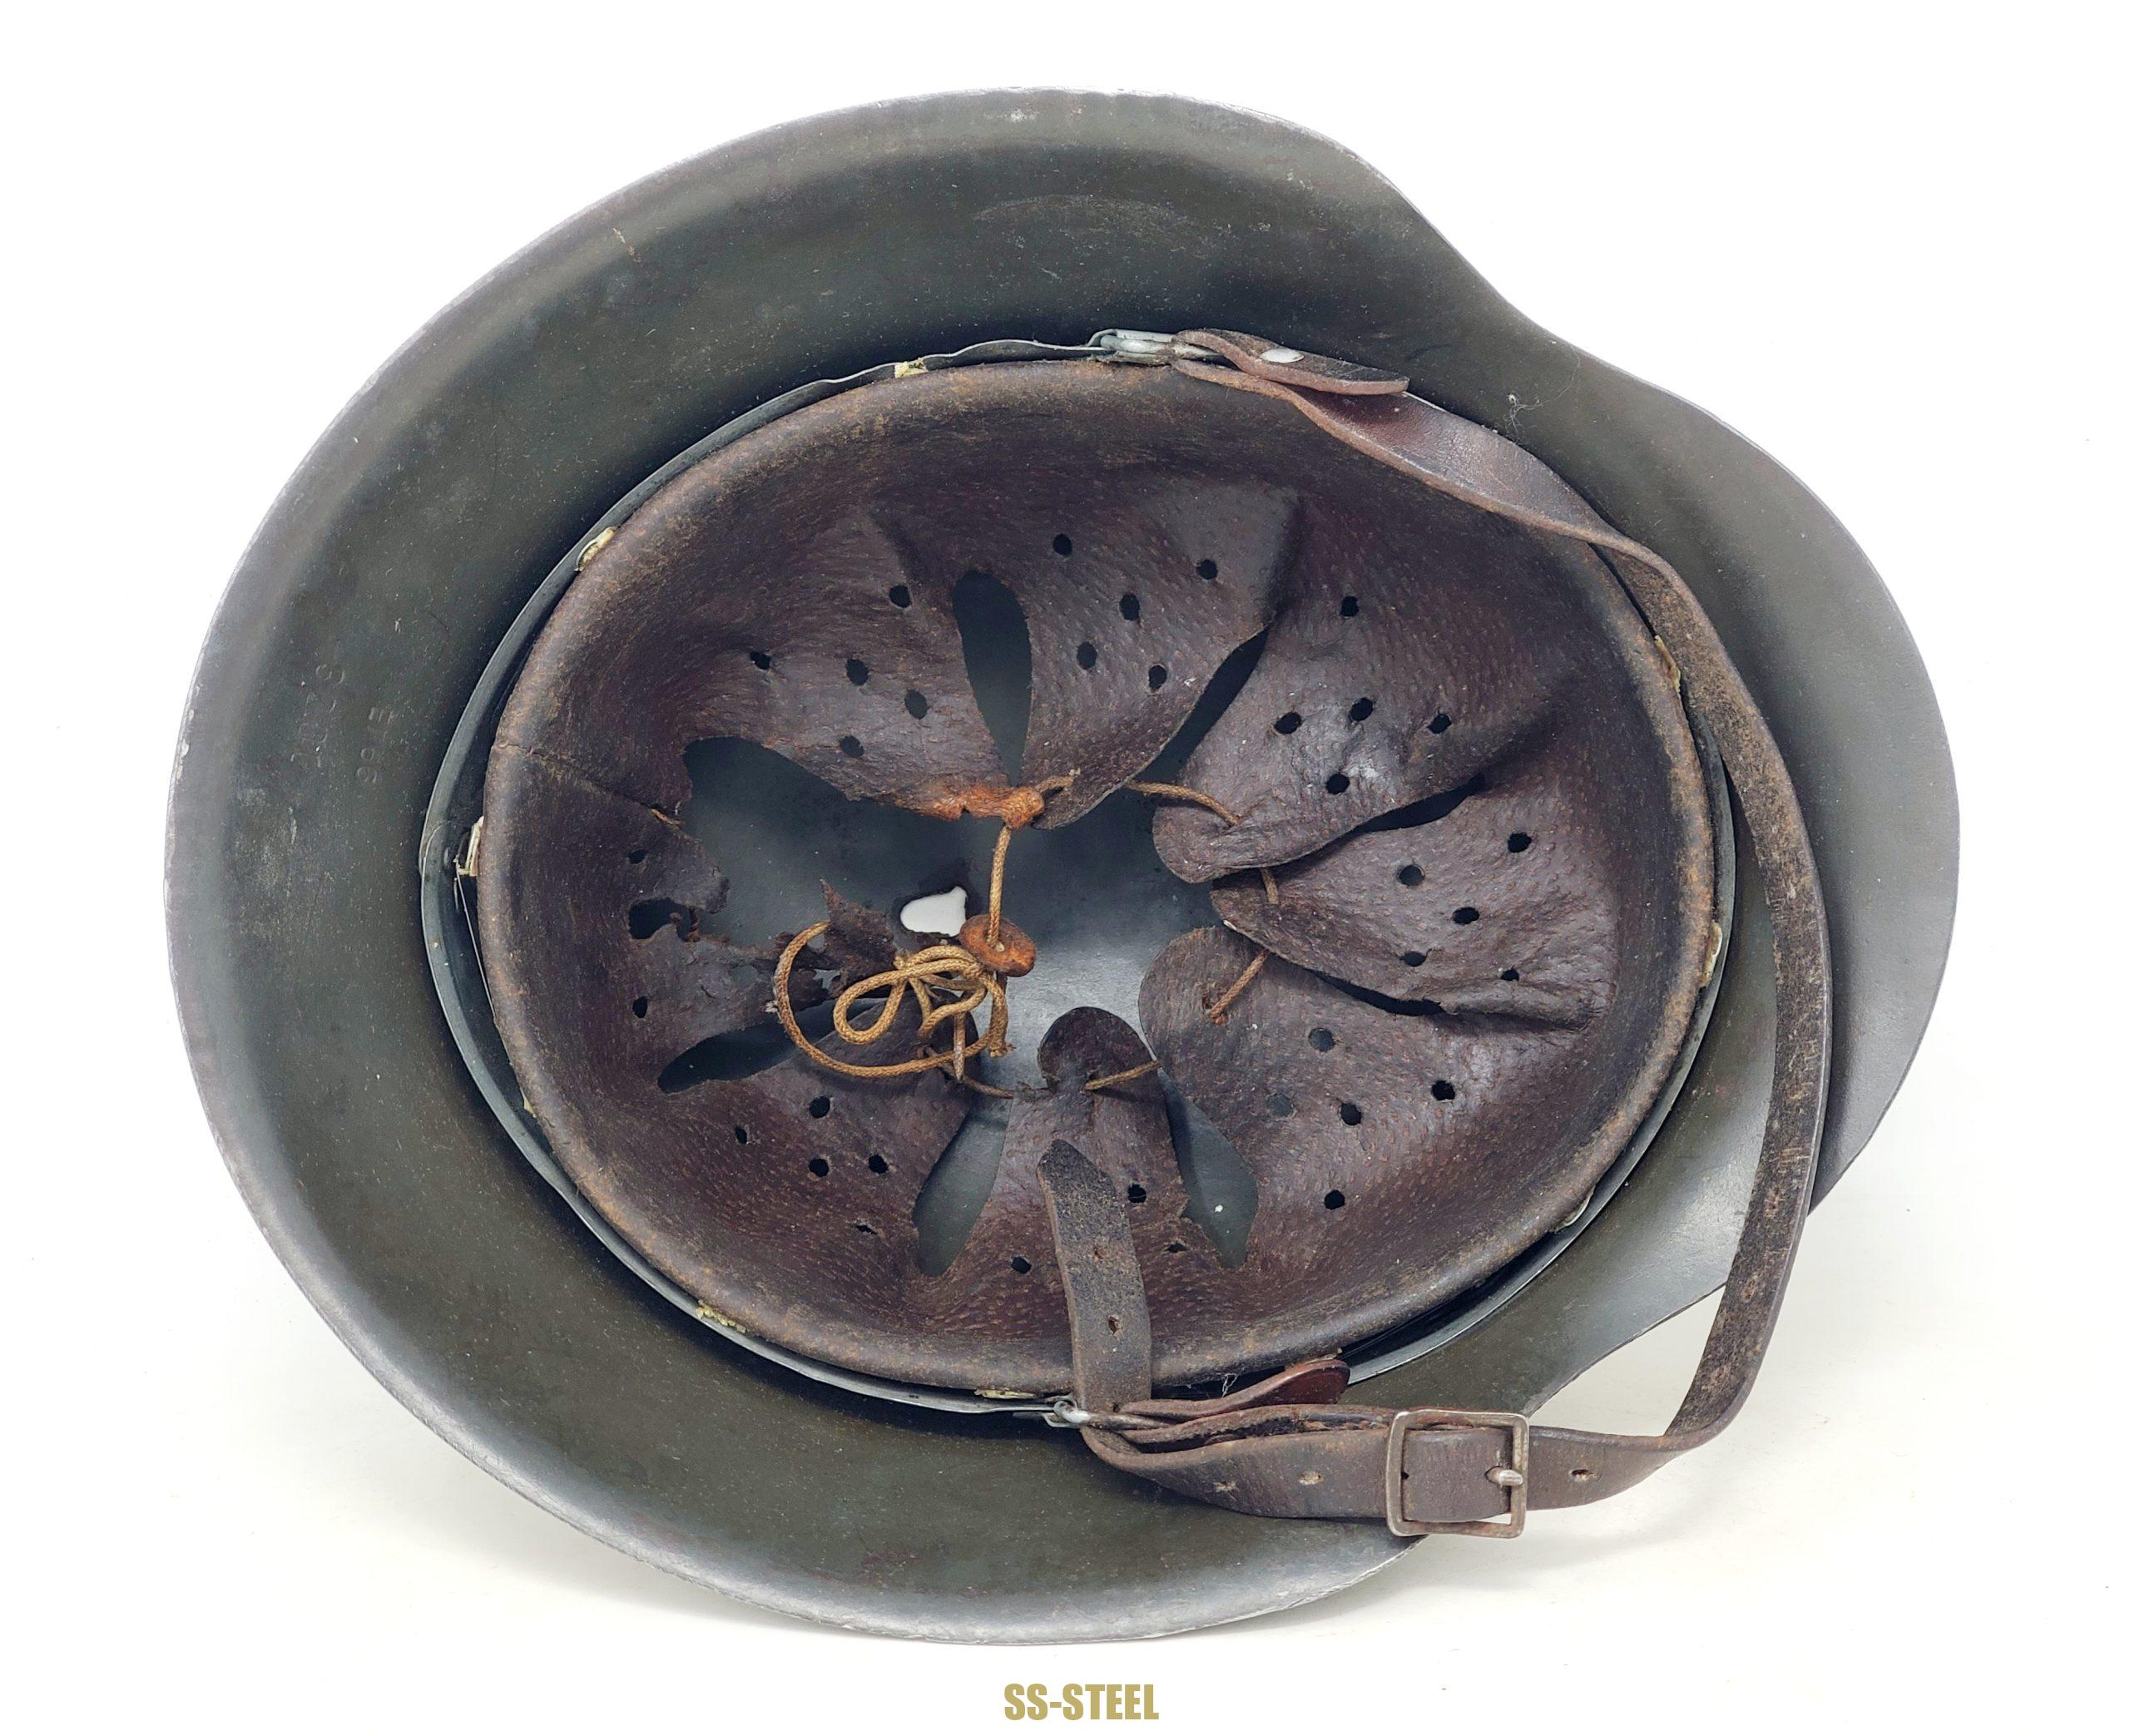
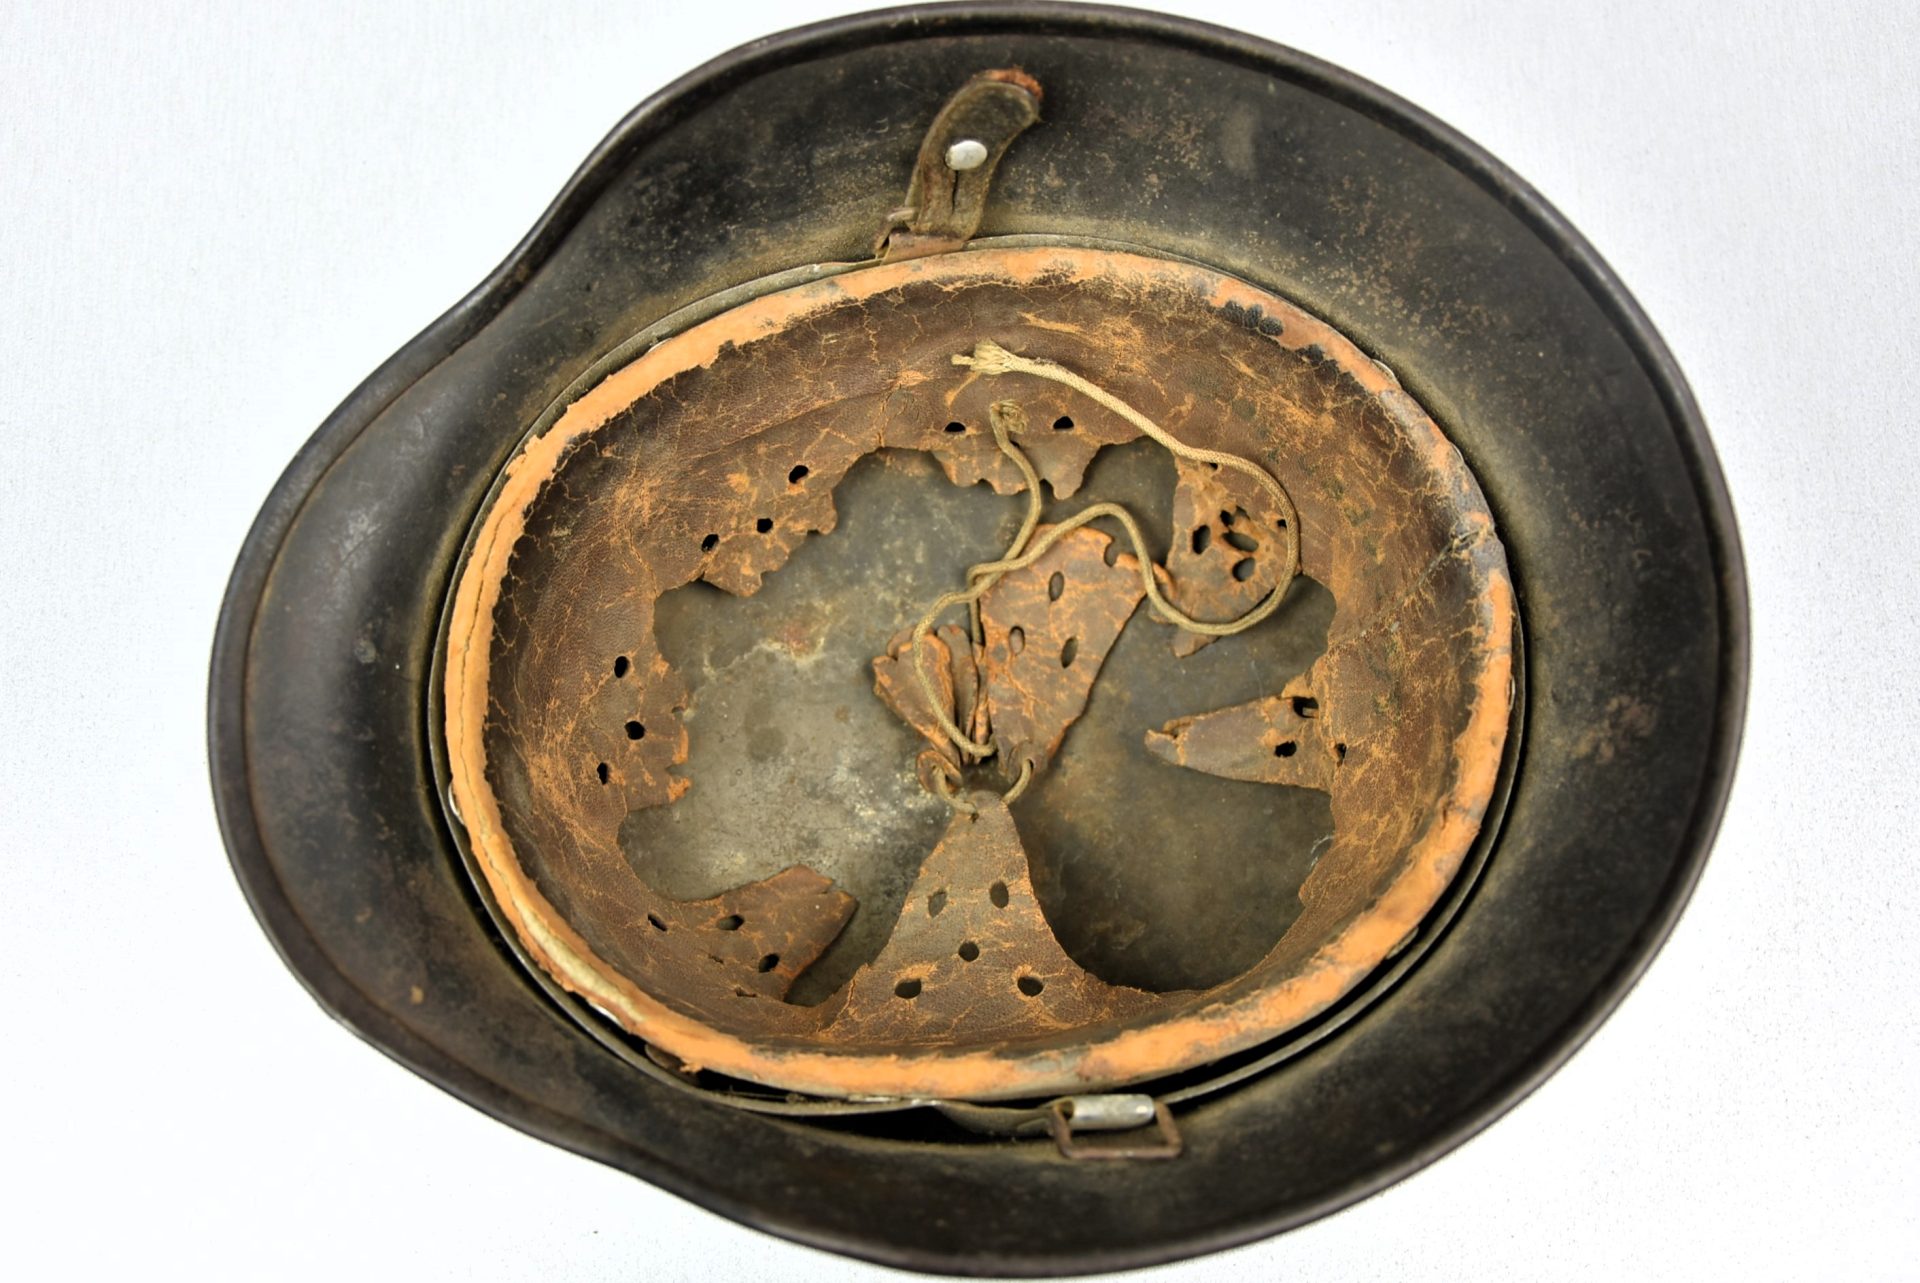
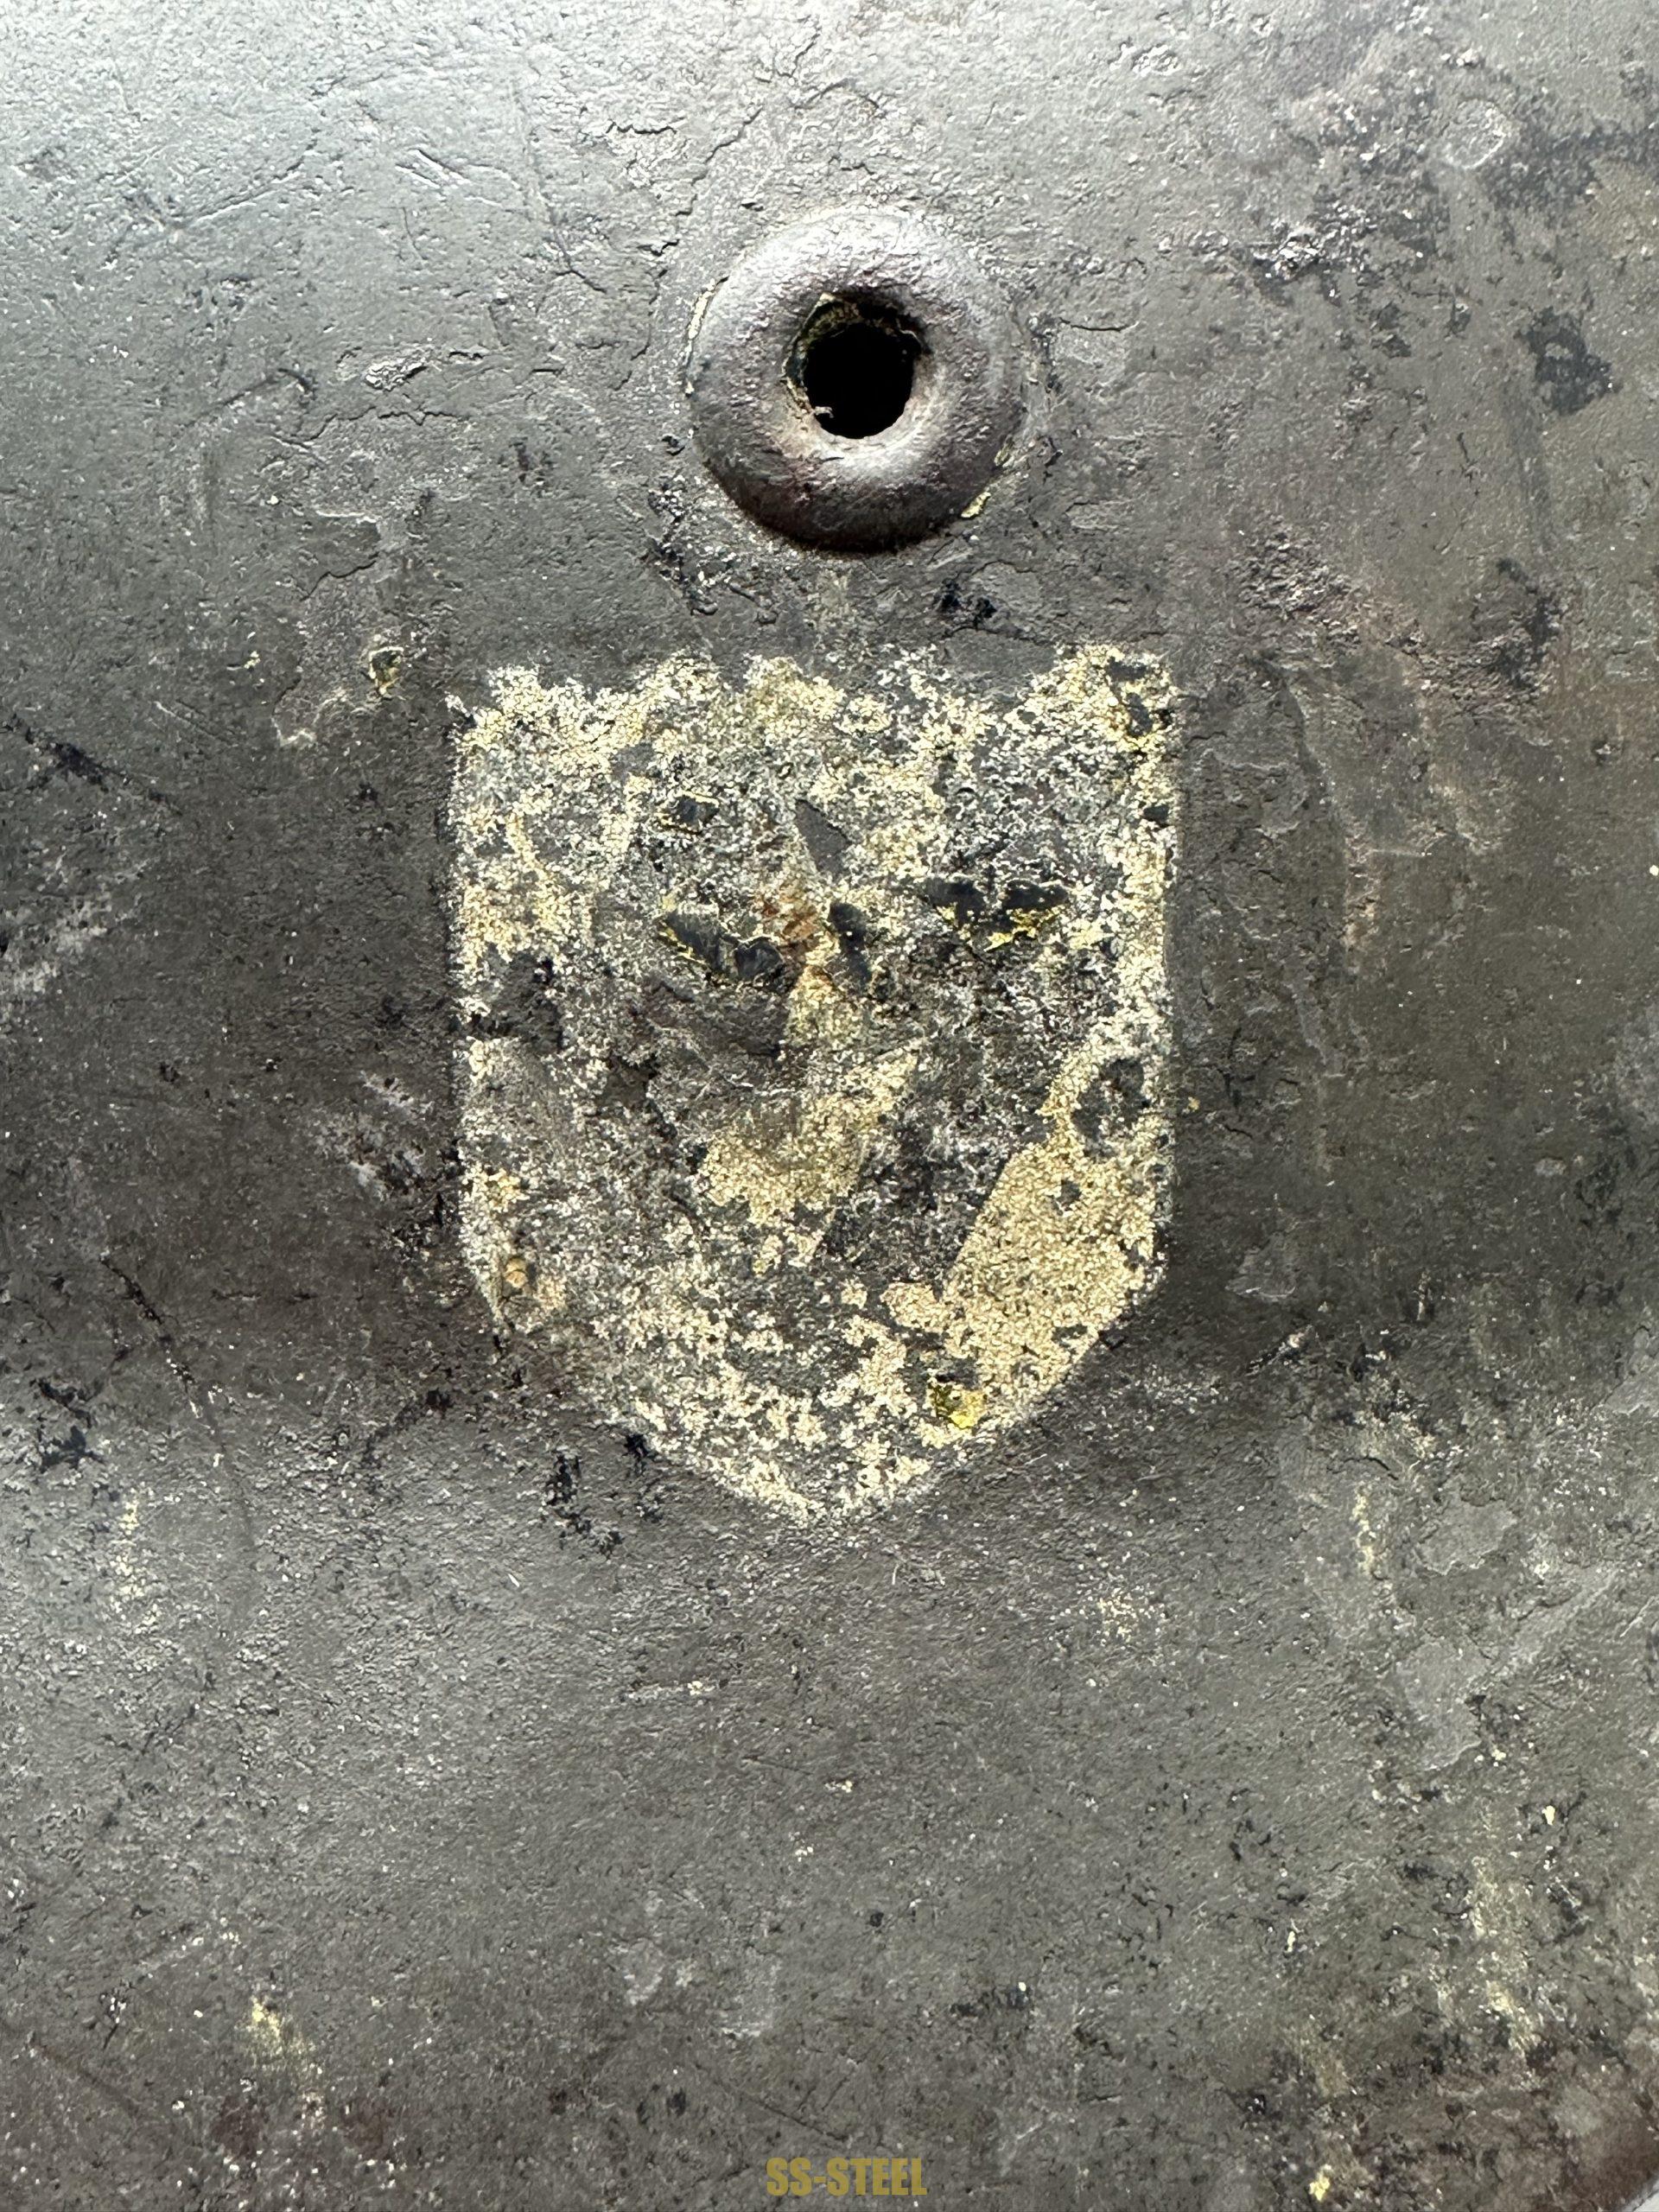
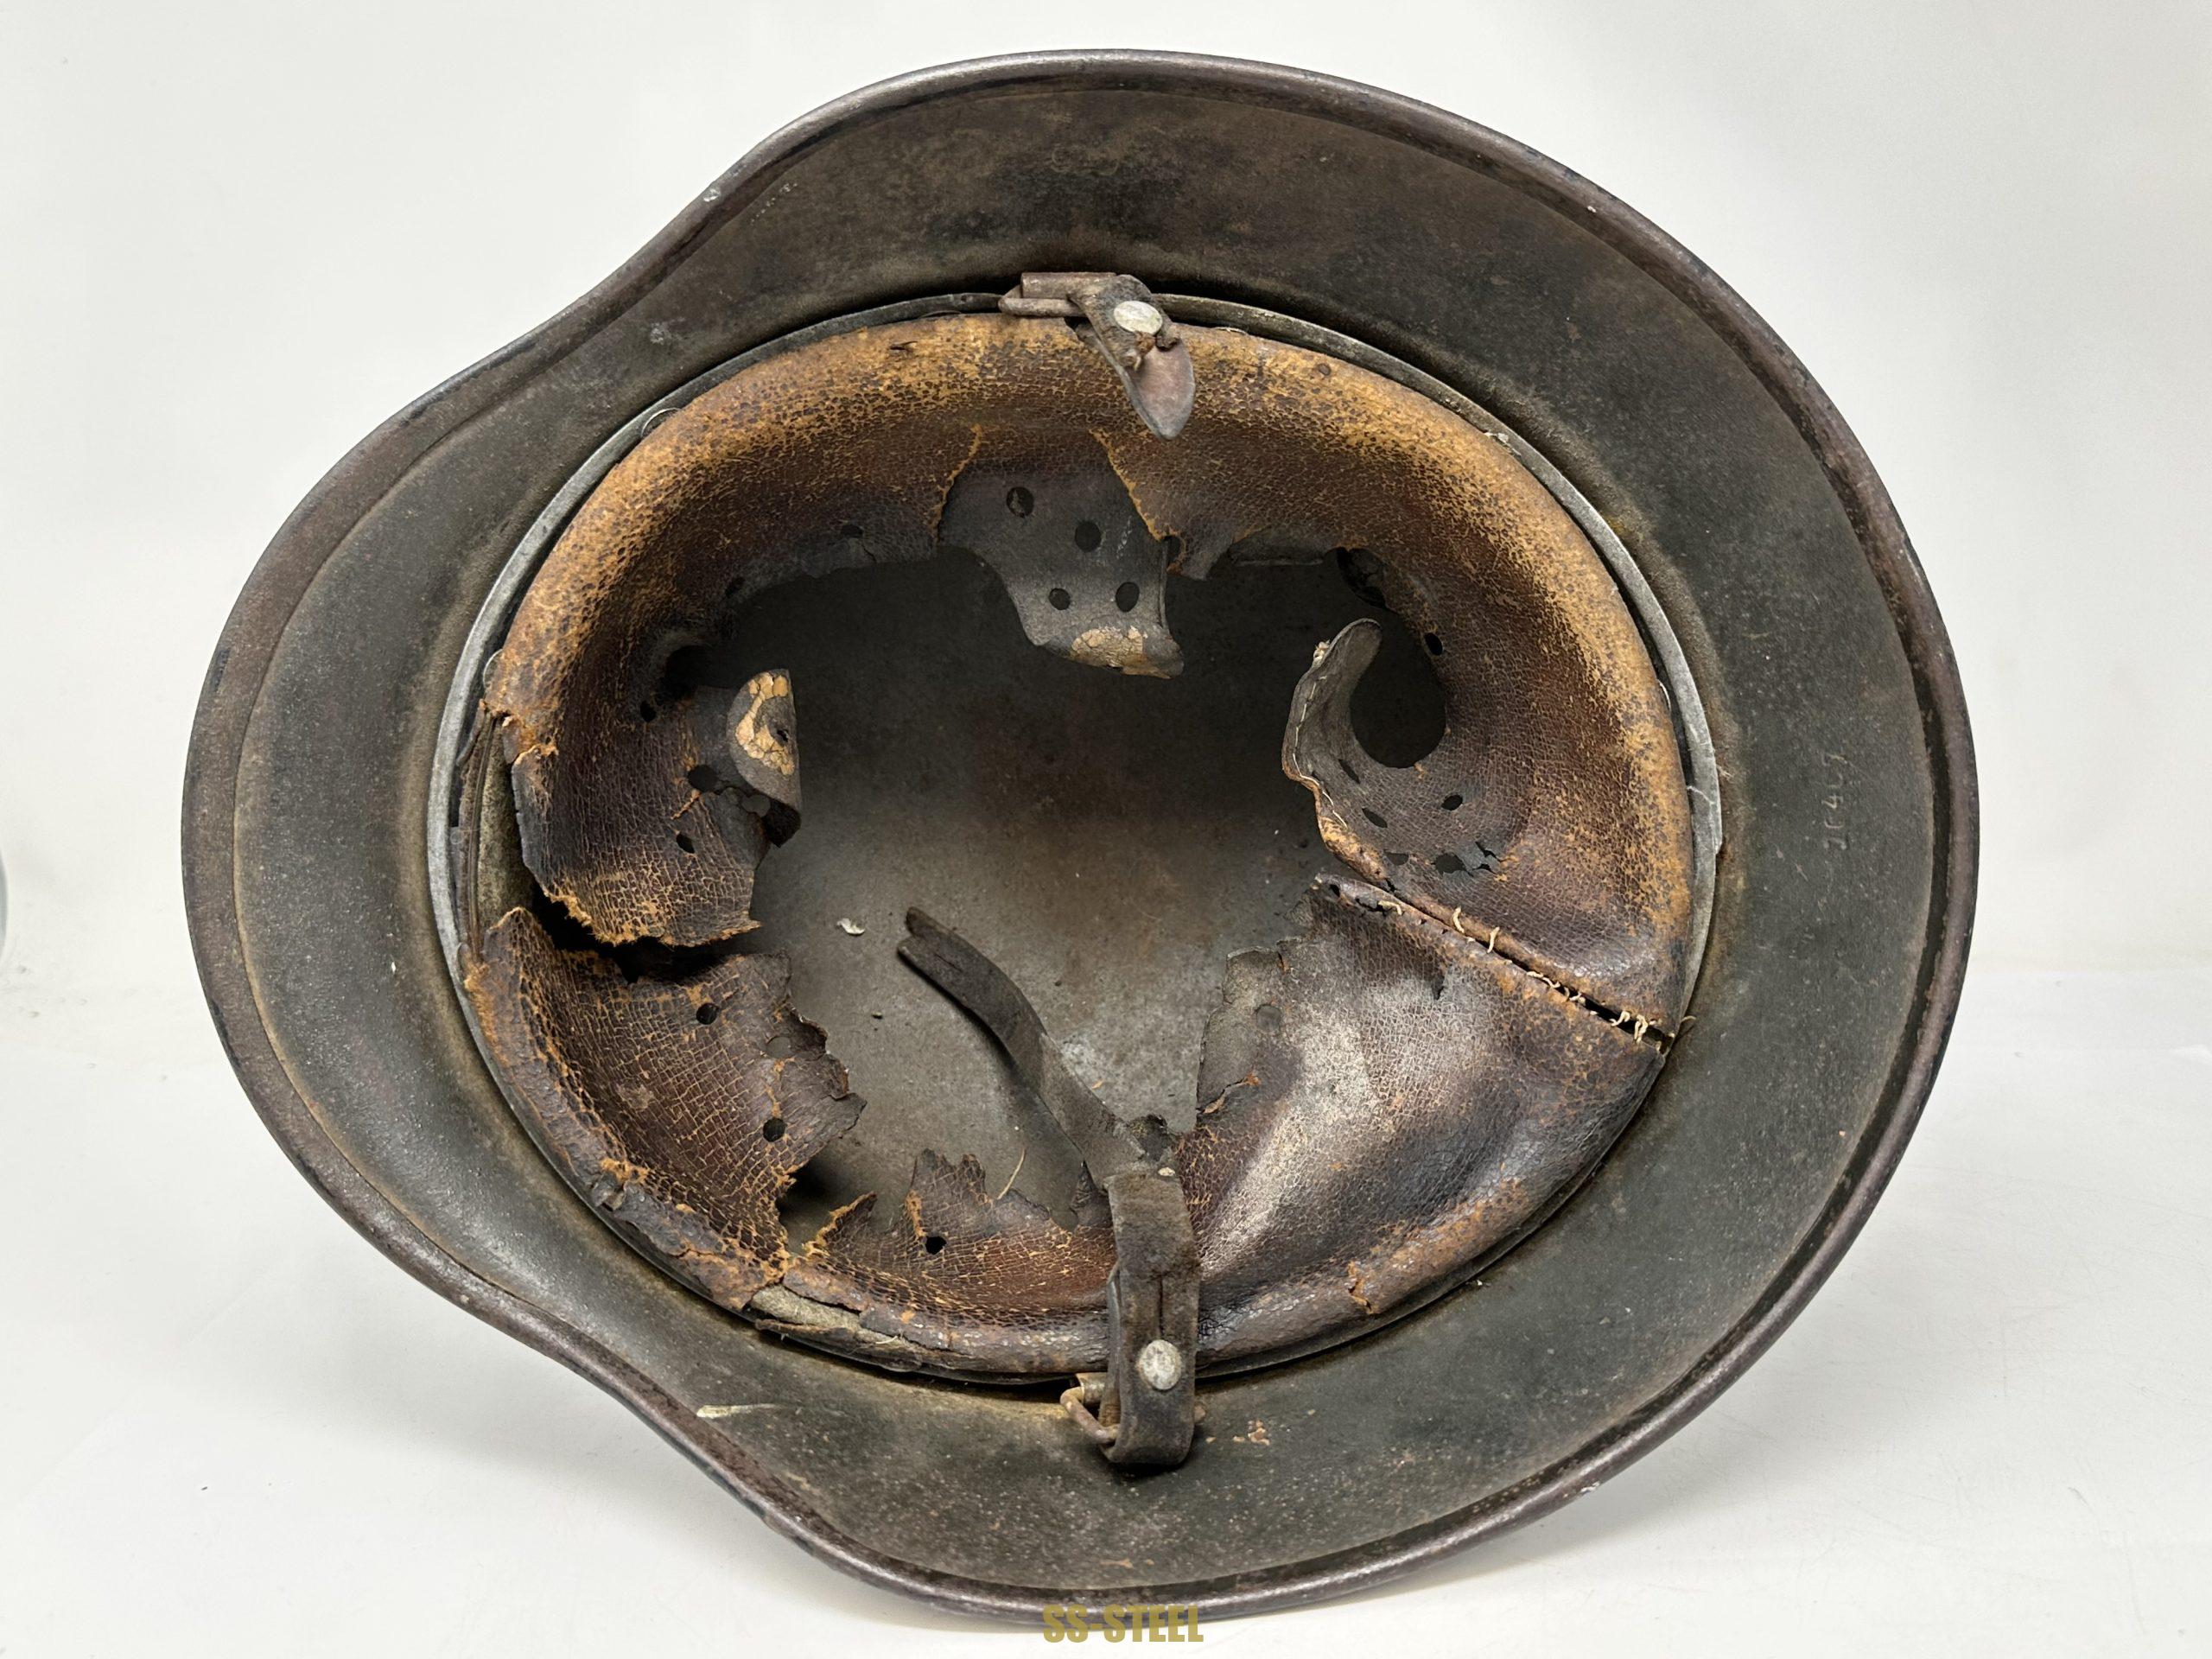
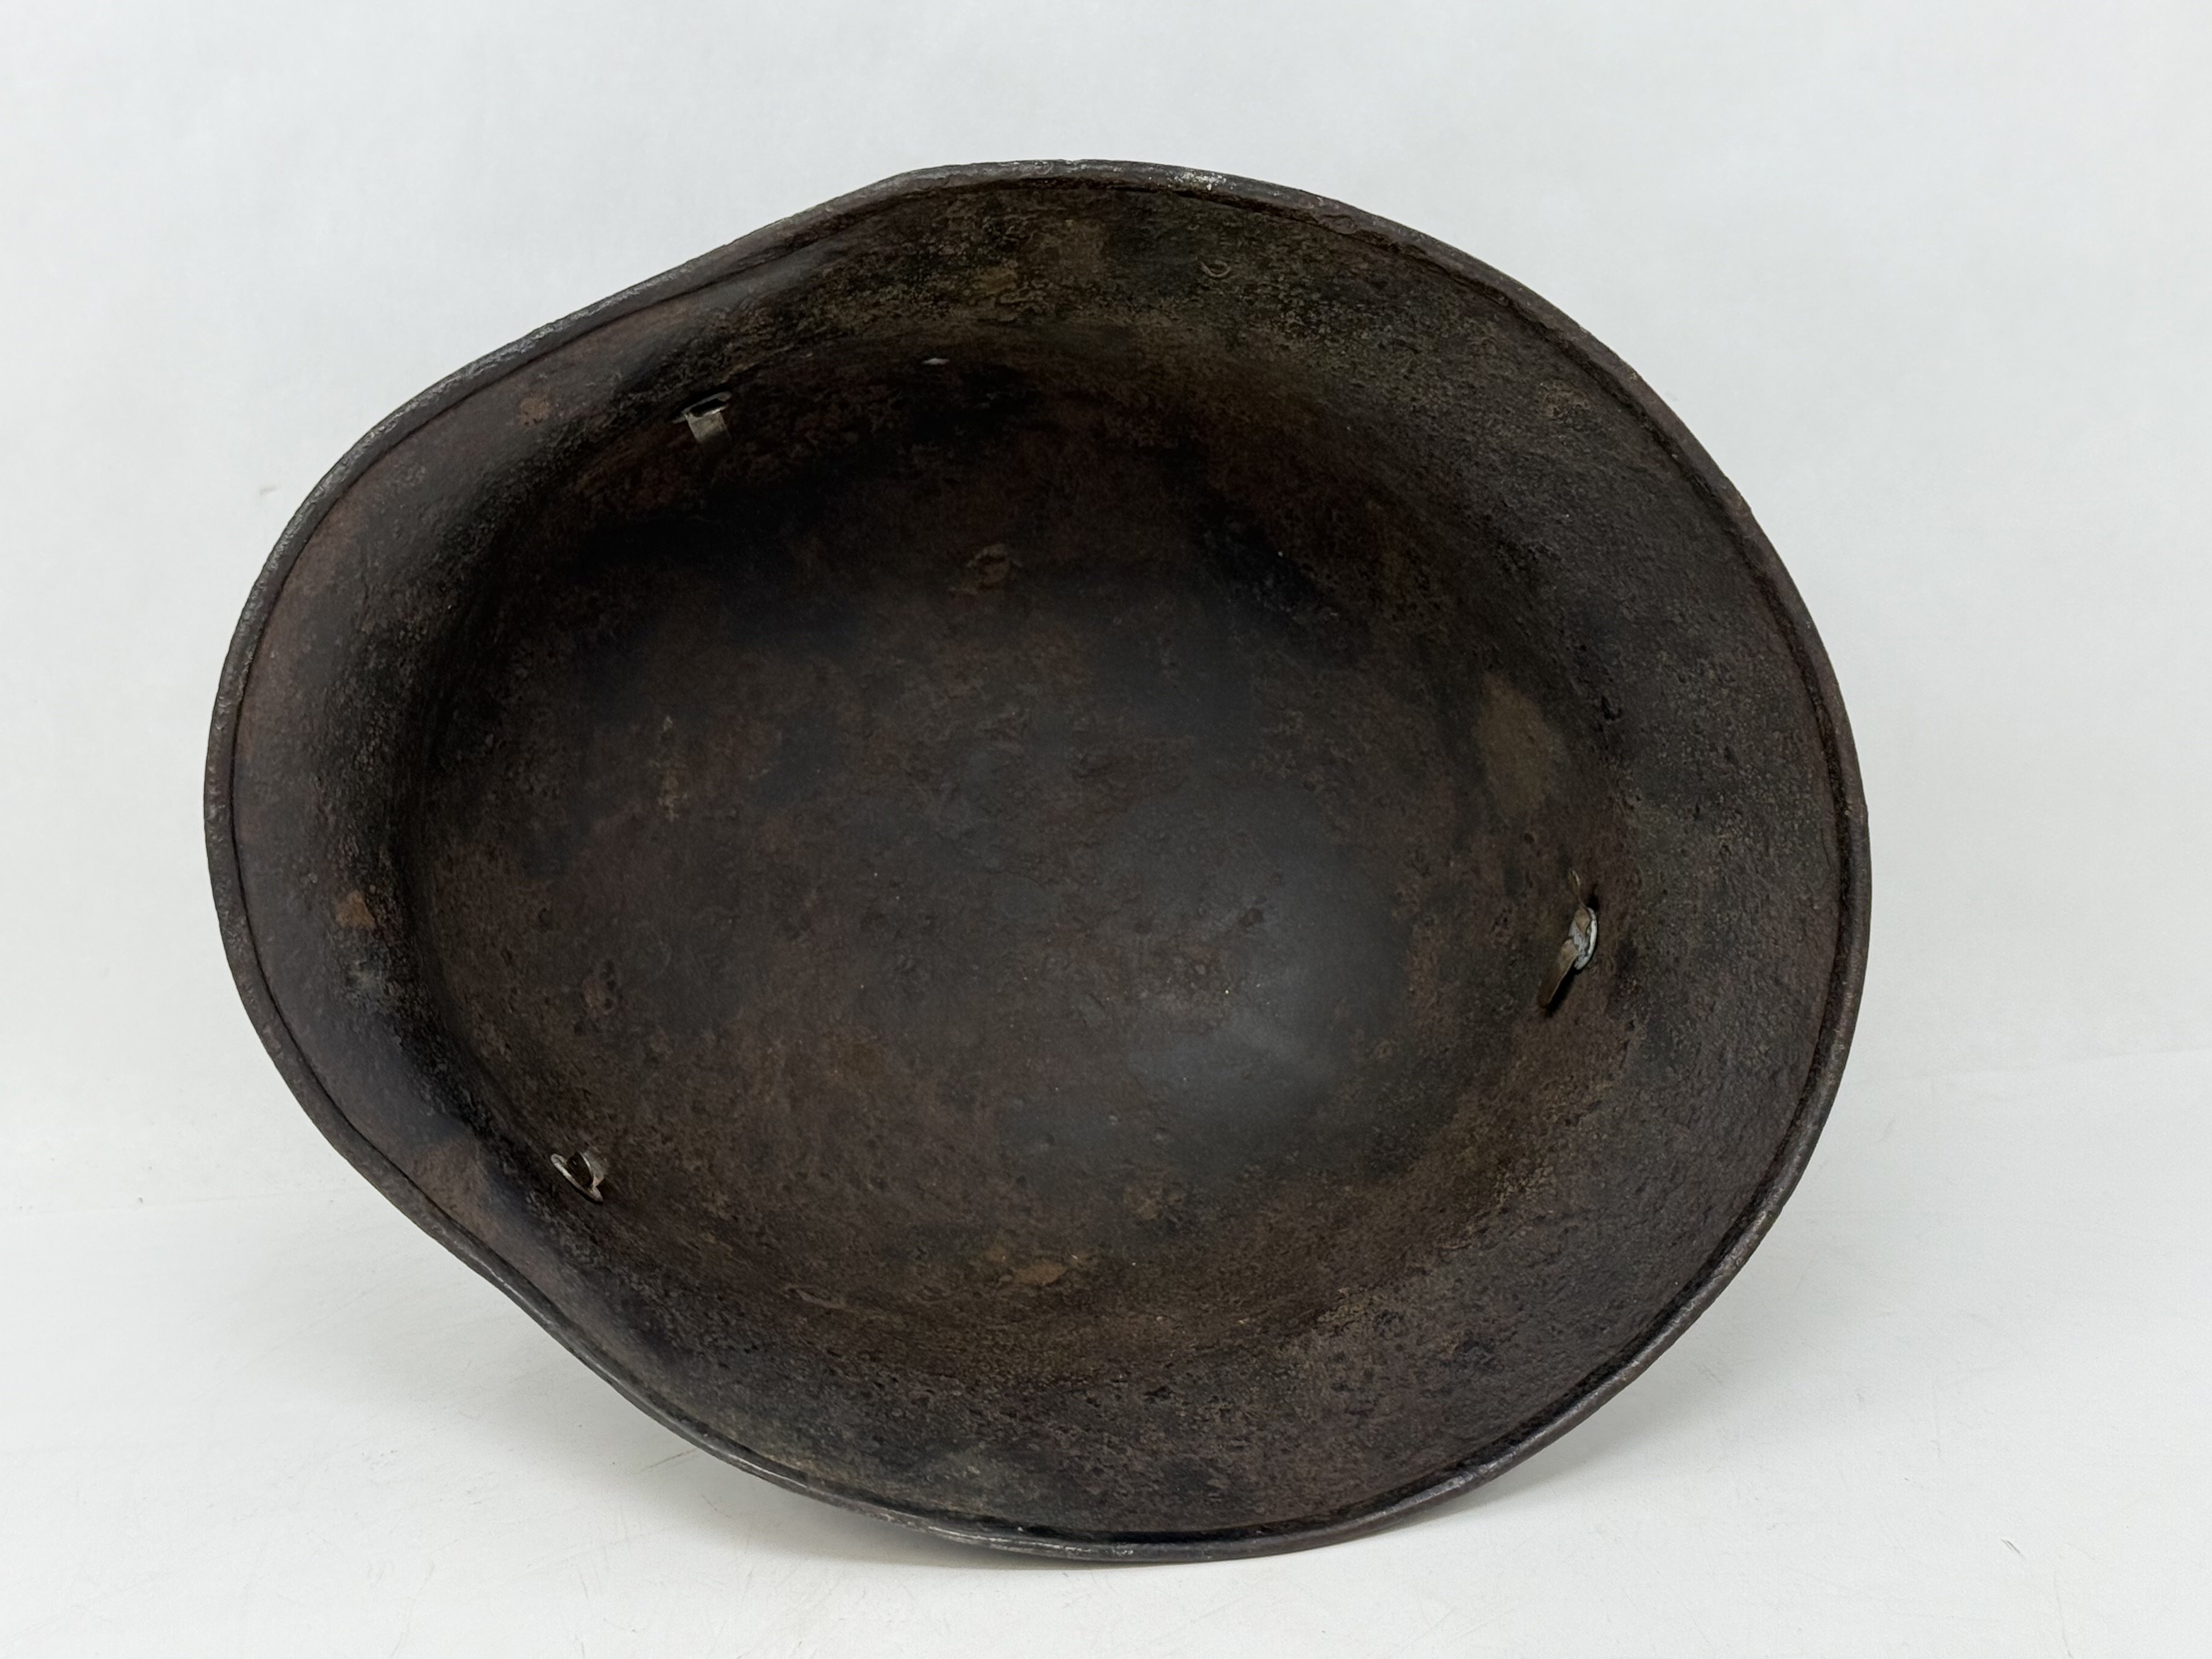
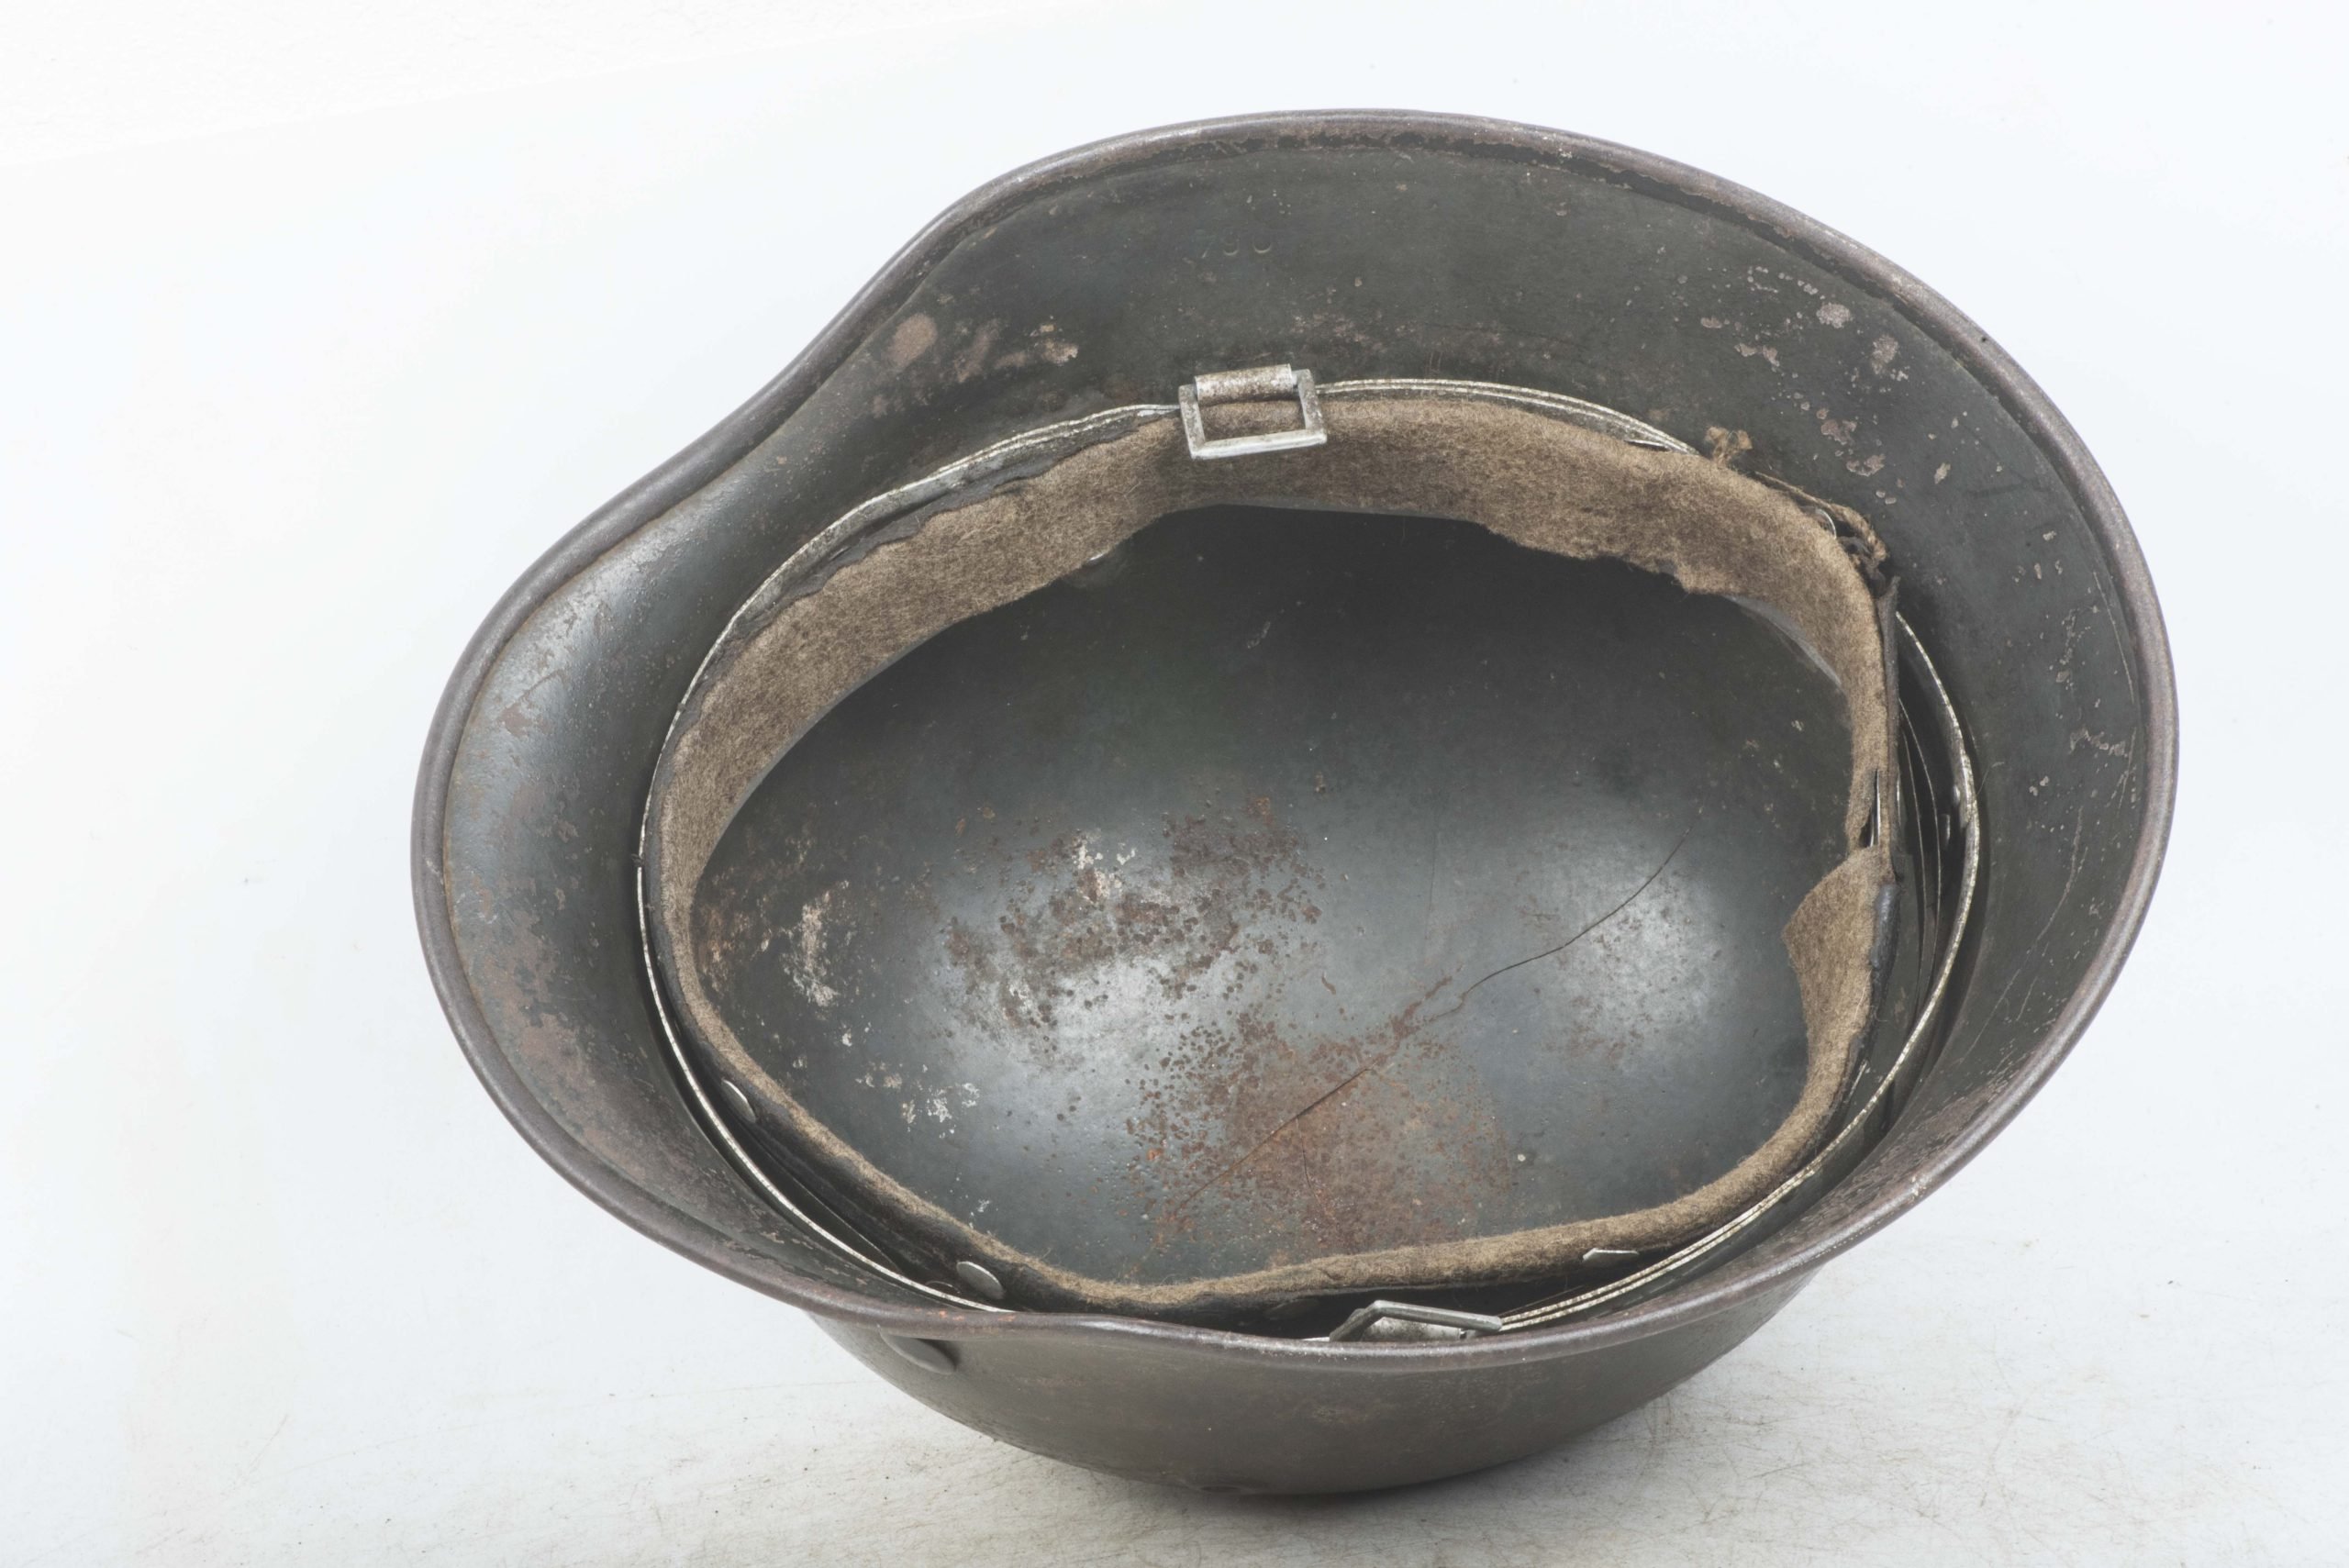
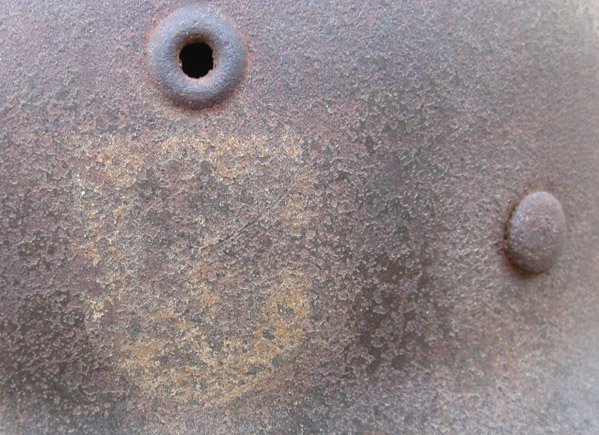
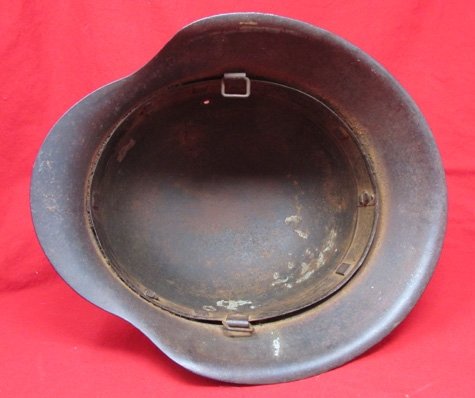
In my assessment, it is the overall shape and completeness of the helmet that matters. I am not only looking at how the shell appears from the outside. I also look at how the liner sits and holds its shape, whether all the parts are present, how much of the decal is still there, how honest the wear feels, and other similar details. Those elements are then combined into condition tiers that feed the pricing model.
SS helmets are a tough test case. They are expensive, heavily faked, and emotionally loaded, and I do not claim to have decades of hands on SS experience. That is exactly why I built this as a proof of concept that uses data, consistent condition grading, and a pricing model to make sense of values instead of relying purely on gut feeling or dealer lore. It took a fair amount of trial and error to get the math to a place where the model’s output actually feels like the real market and sits close to what dealers are asking for similar helmets.
The numbers and ranges you will see here are analytical opinions based on market data and visible condition only. They are meant as a pricing guide and sanity check, not a guarantee of originality or authenticity.